
Figures & data
Figure 1. Northern Devon. (Source: England and Wales map: Office for National Statistics licensed under the Open Government Licence v.3.0. Boundaries: MapIt UK licensed under the Open Government Licence v3.0. Roads: © Ordnance Survey OpenMap Local licensed under the Open Government Licence v3.0.).
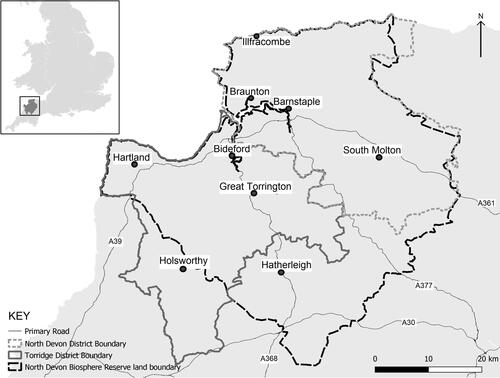
Figure 2. An indicative overview of the research programme. (Source: authors).
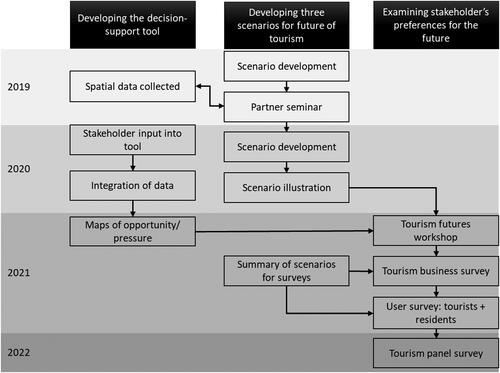
Table 1. Brief descriptive summary of the three scenarios for Northern Devon. (Source: authors).
Table 2. Summary of the four empirical studies. (Source: authors).
Table 3. Scenario preferences stated by stakeholders in three questionnaire surveys. (Source: authors - scenario descriptors refer to Table 1).
Expanded data availability statement
Data availability statement
The studies on which this paper is based are available in aggregate form on Open Research Exeter (ORE), deposited at https://ore.exeter.ac.uk/repository/. The data supporting the studies may be made available to third parties, subject to written authorisation and appropriate permissions being secured. Please contact [email protected] if you are interested in obtaining access to the data.