Figures & data
Figure 1. The ORDC scheme with examples of the most dominant occupations.
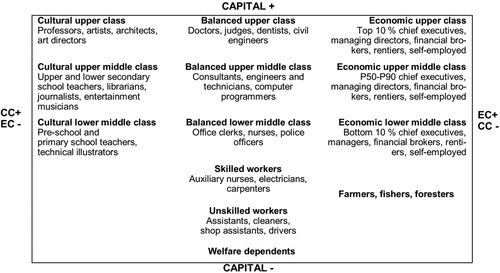
Table 1. Descriptive statistics for upper-class subpopulation.
Figure 2. Distribution of upper-class partner’s vertical class position, by gender.
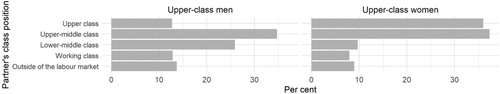
Figure 3. Distribution of upper-class partner’s horizontal class position, by gender and upper-class fraction. Fraction-specific homogamy marked in dark grey.
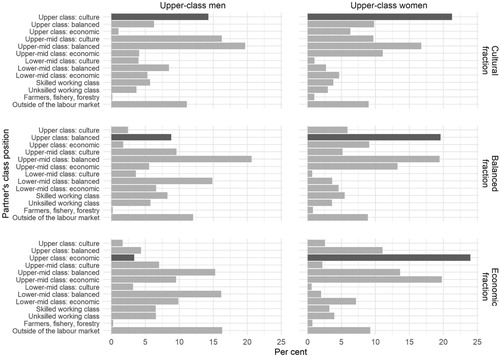
Figure 4. Odds ratios for having a partner in the upper class, by gender and vertical class position. 95% confidence intervals.
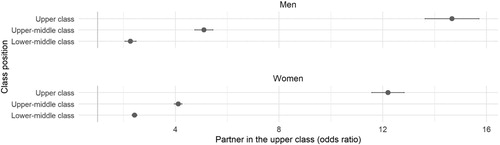
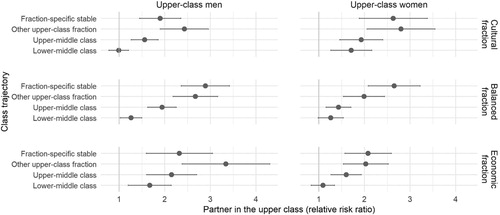
Figure 5. Odds ratios for having a partner in the upper class, by gender and class trajectory of upper-class subpopulation. 95% confidence intervals.
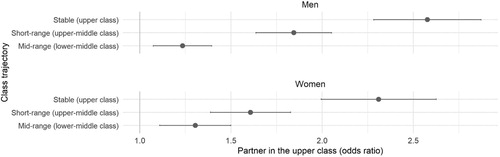
Figure 6. Relative risk ratios for having a partner in the upper class (first row) and in the same upper-class fraction (second row), by gender and upper-class fraction. 95% confidence intervals.
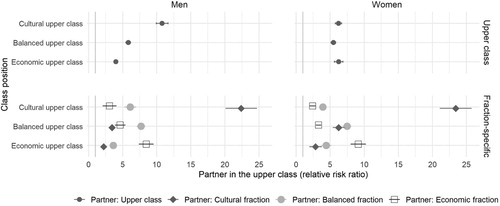
Figure 7. Relative risk ratios for having a partner in the same upper-class fraction, by gender and fraction-specific class trajectory. 95% confidence intervals.