Figures & data
Table 1. Inclusion criteria for the analyses among Dutch ethnic majority adolescents.
Figure 1. Dutch ethnic majority out-group attitudes on average and split by ethnic group.
Note: The number of bins vary as two of the metrics average out-group attitude across groups.
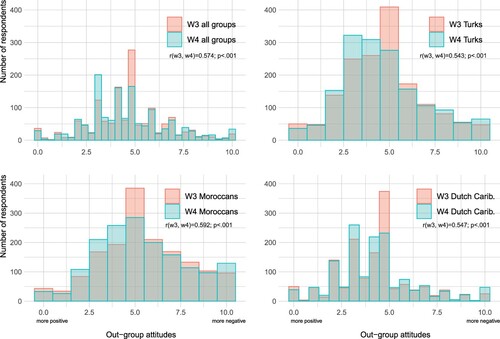
Figure 2. The number of interethnic contacts on Facebook for Dutch majority adolescents.
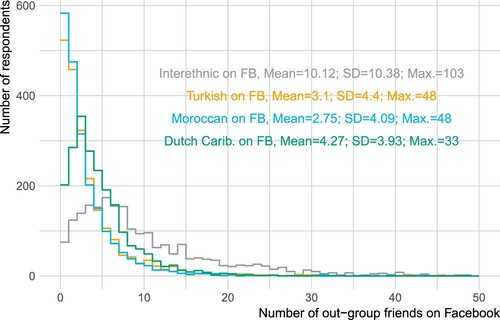
Table 2. Descriptive statistics for the control variables.
Table 3. Regressing negative out-group attitudes on the number of interethnic contacts on Facebook.
Table 4. Regressing negative out-group attitudes on the number of interethnic contacts on Facebook and out-group attitudes t − 1.Table Footnotea
Table 5. Regressing negative out-group attitudes on the logged number of interethnic contacts on Facebook.Table Footnotea
Table 6. Regressing negative out-group attitudes on the logged number of interethnic contacts on Facebook and out-group attitudes t − 1.Table Footnotea
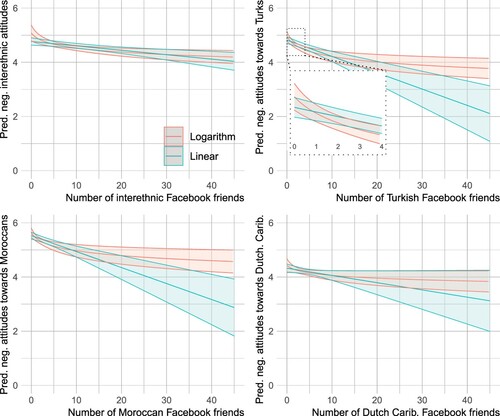
Figure 3. Predicted values for out-group attitudes for both the linear and logarithmic number of out-group contacts on Facebook (based on results from and ).