Figures & data
Figure 1. Overlap between different support networks.
Note: The circles of the Venn diagram represent recipients of support from the different support networks. It illustrates how strongly the different support networks overlap and that barely anyone received support from neighbors or civil society alone. Percentages are relative to the entire sample. The Venn diagram is proportional to the relation between variables (see Appendix 1, Table A1.1 for further details).
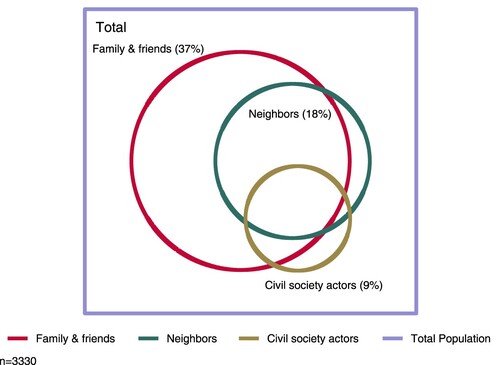
Figure 2. Marginal effects of the three elements of social capital on the probability of receiving social support from different support networks (comparing three separate models).
Note: presents marginal effects of the three independent variables of interest: size of one’s support network, organizational membership and social trust on the probability of receiving support from one of the three support networks ((1) Family and friends, (2) Neighbors, (3) Civil society) among all people receiving any social support. For example, an increase of one unit in the size of one’s support network increases the probability of receiving support from family and friends by 0.01, from neighbors by 0.05, and from civil society by 0.04. Marginal effects are calculated on the basis of Models 2, 3 and 4 in Table A1.2, Appendix 1.
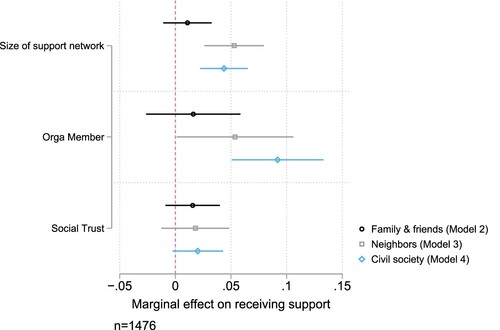
Figure 3. Marginal effects of the three elements of social capital on the probability of receiving social support from overlapping support networks (comparing three separate models).
Note: presents the effect of the three independent variables of interest: size of one’s support network, organizational membership and social trust on receiving support from one of three mutually exclusive support constellations: (1) Family and friends only, (2) Family, friends + neighbors, and 3) Family and friends + neighbors + civil society. Marginal effects are calculated on the basis of Models 2, 3 and 4 in Table A1.3, Appendix 1.
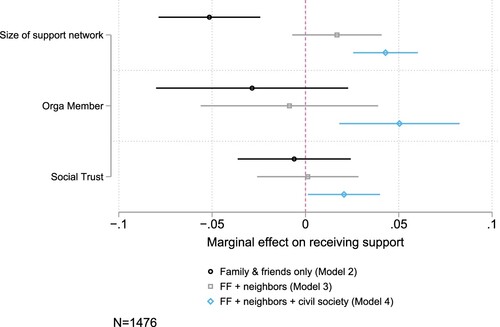
Figure 4. Marginal effects of receiving support from the different support networks on the probability of receiving insufficient support.
Note: presents marginal effects of receiving support from the different support networks on the probability of receiving insufficient support. Marginal effects are calculated on the basis of Model 1 in Table A1.4, Appendix 1. The different support networks are included as independent variables in the same model.
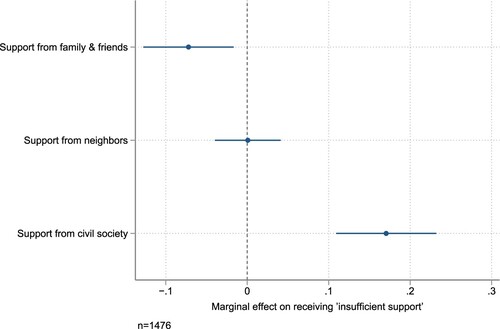
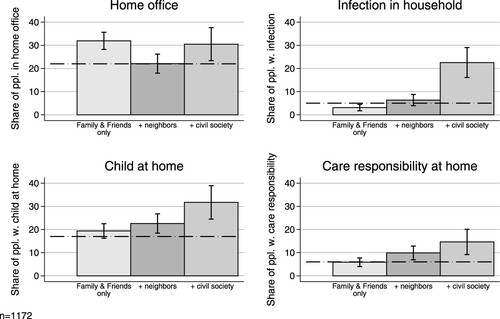
Figure 5. Share of people with pandemic-related burdens who received support from different support networks.
Note: displays different pandemic burdens by different support networks, which are defined mutually exclusively (1) Family and friends only, (2) Family, friends + neighbors, and (3) All three networks present (Family & friends, neighbors + civil society). The dotted horizontal lines represent the population average for each of the four pandemic burdens. Of those who received support in the overall sample, 41% received support from family & friends only, 26% received support from family, friends + neighbors, and 11% received support from all three groups (+ civil society).