
Figures & data
Figure 1. Sample vignette.
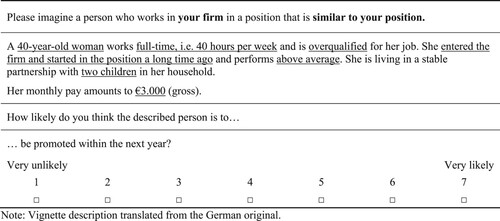
Table 1. Vignette dimensions and levels.
Table 2. Descriptive overview of the key variables.
Figure 2. Perceived promotion penalties: impact of a fictitious co-worker’s gender, parenthood status and working hours on evaluated promotion chances, regression coefficients and 95% confidence intervals.
Note: Visualization based on model 1 from Supplementary Table A12: N (evaluations) = 5512, N (individuals) = 3761. Controls: Vignette level = Age, gross earnings, qualification, tenure, job performance, evaluated fairness of vignette wage, order of vignette appearance; Respondent level = Gender, children in household, part-time, holding a supervisory position. +P<0.1 *P<0.05, **P<0.01, ***P<0.001. Data: ‘Fair: Arbeiten in Deutschland’ (Strauß et al. Citation2022), own calculations.
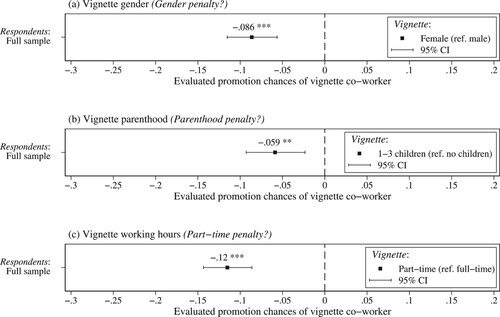
Figure 3. Gender-specific promotion penalties: AME with 95% confidence intervals of interactions between.
Note: Visualization based on model 2 from Supplementary Table A12: N (evaluations) = 5512, N (individuals) = 3,761. +P<0.1 *P<0.05, **P<0.01, ***P<0.001. Data: ‘Fair: Arbeiten in Deutschland’ (Strauß et al. Citation2022), own calculations.
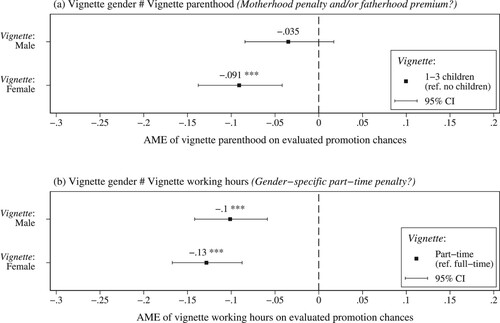
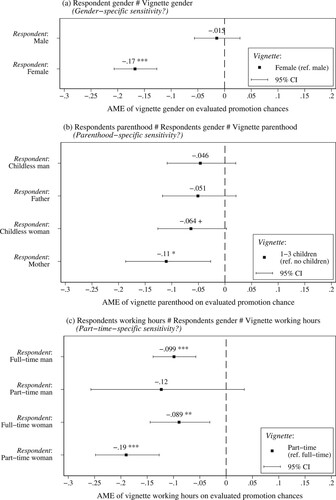
Figure 4. Respondent-specific promotion penalties: AME with 95% confidence intervals of interactions between.
Note: Visualization based on model 2 from Supplementary Table A12: N (evaluations) = 5512, N (individuals) = 3,761. +P<0.1 *P<0.05, **P<0.01, ***P<0.001. Data: ‘Fair: Arbeiten in Deutschland’ (Strauß et al. Citation2022), own calculations.
Supplemental Material
Download PDF (705.8 KB)Data availability statement
Data and documentation of ‘Fair: Arbeiten in Deutschland’ can be found at https://doi.org/10.7802/2486
.