Figures & data
Figure 1. Example of a two-state Markov chain.
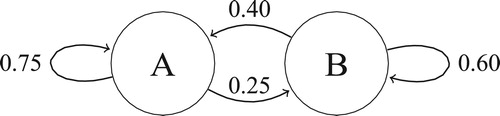
Table 1. An exemplary selection of the data from user Z.
Table 2. Transition probabilities training set (80%)—six states.
Table 3. Transition probabilities test set (20%)—six states.
Figure 2. The probability of users changing from one news topic to another news topic: Homepage or section page, Politics, Business, Entertainment, Other, and End of Web session.
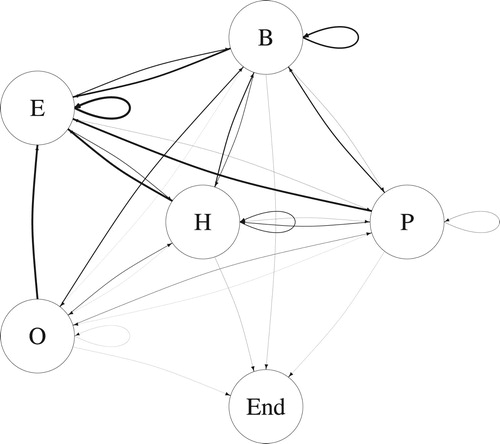
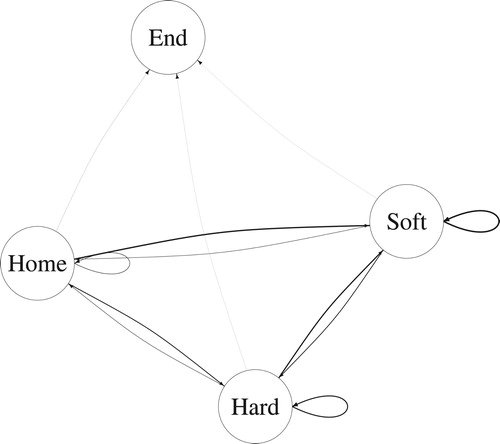
Figure 3. The probability of users changing between hard and soft news: Homepage or section page, Hard news, Soft news, and End of Web session.