Figures & data
Figure 1. Average housing wealth by age and UK region: 2010.
Source: Understanding Society and Labour Force Survey, author's analysis.
Figure 2. Housing equity by income and age groups (owners and renters): England 2011.
Source: English Housing Survey, author's analysis.
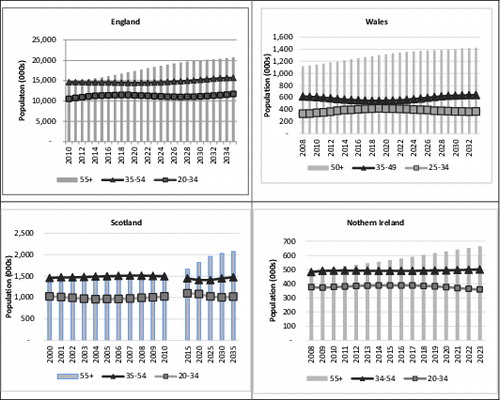
Figure 3. Population projections for UK (selected age groups).
Source: 2010-based Subnational Population Projections, Table 1 England and English Regions; General Registrars of Scotland; 2008-based population projections for the Spatial Plan areas of Wales; NISRA, 2008-based Sub-Northern Ireland Population Projections.