1,667
Views
1
CrossRef citations to date
0
Altmetric
Article

Association between attachment anxiety and the gaze direction-related N170

&

Figures & data

Figure 1. (a) Experimental conditions. Eye gaze direction could be straight (direct) or averted, and head orientation could be frontal or deviated. (b) Trial sequence. After a jittered fixation cross, a face was presented, followed by a blank screen until the response. Afterward, another blank screen was displayed.
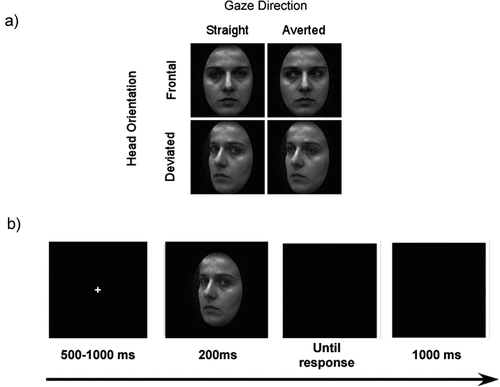
Figure 1. (a) Experimental conditions. Eye gaze direction could be straight (direct) or averted, and head orientation could be frontal or deviated. (b) Trial sequence. After a jittered fixation cross, a face was presented, followed by a blank screen until the response. Afterward, another blank screen was displayed.

Table 1. Mean scores (with standard deviation (SD) and min/max) and correlation between attachment questionnaire scores.

Figure 2. N170 for straight and averted gaze (N = 50). A) The time course of the overall mean of the ERP across all participants is shown on the typical left (P7, P9, PO7) and right (P8, P10, PO8) occipitotemporal clusters for the straight (in black) and averted (in grey) gaze conditions in the frontal head direction (solid) and deviated head direction (dotted). B) From 130–200ms, there was a small but reliable interaction effect of head orientation and gaze direction. Error bars represent 1 SEM.
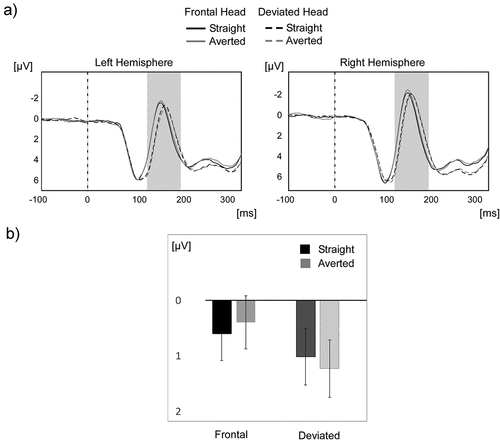
Figure 2. N170 for straight and averted gaze (N = 50). A) The time course of the overall mean of the ERP across all participants is shown on the typical left (P7, P9, PO7) and right (P8, P10, PO8) occipitotemporal clusters for the straight (in black) and averted (in grey) gaze conditions in the frontal head direction (solid) and deviated head direction (dotted). B) From 130–200ms, there was a small but reliable interaction effect of head orientation and gaze direction. Error bars represent 1 SEM.

Figure 3. Illustration of the N170 amplitudes for different eye gaze directions in the left and right hemispheres for participants with low AX (in panel a) and high AX (in panel b). The black lines represent straight gaze N170 amplitudes in the left and right hemispheres, and the grey lines represent averted gaze N170 amplitudes. Depicted are the estimated means of the respective 2×2 rANOVAs. Interhemispheric asymmetry for straight and averted N170 conditions is shown in panel c. A larger inter-hemispheric asymmetry (an increased involvement of the right hemisphere) means a larger involvement of holistic processing, while a lack of inter-hemispheric asymmetry means lower involvement of holistic processing, that is a larger involvement of analytic processing. Finally, in panel d, the correlation between the difference in inter-hemispheric asymmetry between straight versus averted N170 amplitudes and AX is depicted. While participants scoring low on AX showed a tendency to more holistically perceive an averted over a straight gaze direction, participants scoring high on AX displayed the opposite tendency. Error bars represent 1 SEM.
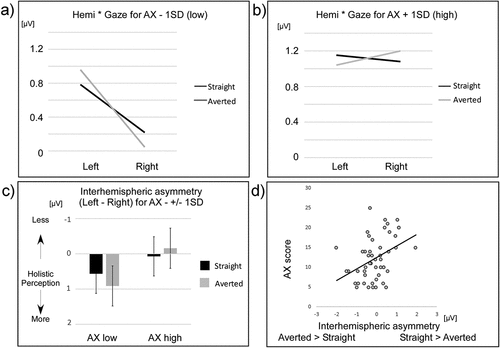
Figure 3. Illustration of the N170 amplitudes for different eye gaze directions in the left and right hemispheres for participants with low AX (in panel a) and high AX (in panel b). The black lines represent straight gaze N170 amplitudes in the left and right hemispheres, and the grey lines represent averted gaze N170 amplitudes. Depicted are the estimated means of the respective 2×2 rANOVAs. Interhemispheric asymmetry for straight and averted N170 conditions is shown in panel c. A larger inter-hemispheric asymmetry (an increased involvement of the right hemisphere) means a larger involvement of holistic processing, while a lack of inter-hemispheric asymmetry means lower involvement of holistic processing, that is a larger involvement of analytic processing. Finally, in panel d, the correlation between the difference in inter-hemispheric asymmetry between straight versus averted N170 amplitudes and AX is depicted. While participants scoring low on AX showed a tendency to more holistically perceive an averted over a straight gaze direction, participants scoring high on AX displayed the opposite tendency. Error bars represent 1 SEM.
Supplemental material

Supplemental Material

Download MS Word (50.6 KB)