Figures & data
Table 1. Summary of WMCI representation subscales.
Figure 1. WMCI representation classifications by overall representation and subclassifications.
Note. Balanced n = 179, Disengaged n = 43, Distorted n = 74.
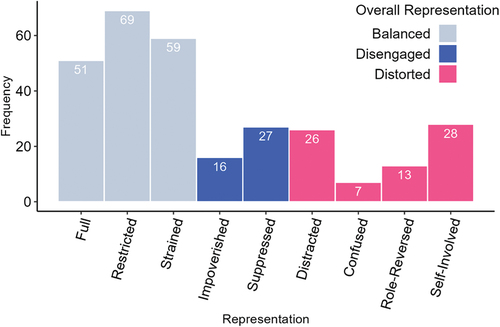
Table 2. Descriptive statistics for continuous variables of interest.
Table 3. Bivariate Pearson correlations.
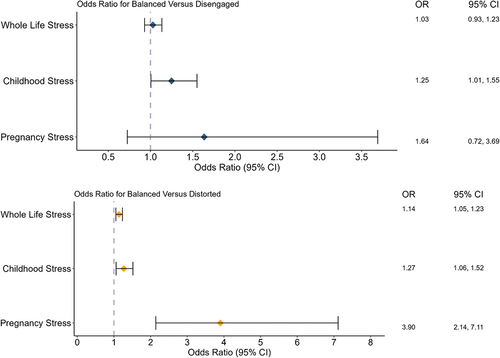
Figure 2. Odds ratio for being classified as balanced vs. disengaged (top panel) and balanced vs. Distorted (bottom panel) by stress.