Figures & data
Figure 1. Evolution of the Gini index in Hungary, the Czech Republic and Poland. Source: World Bank.
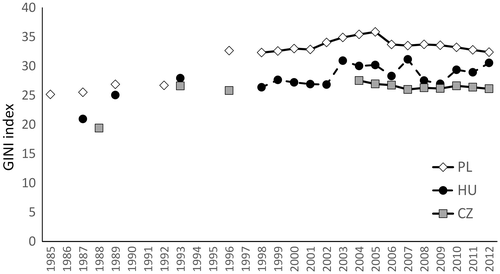
Figure 2. Evolution of median household income and domestic energy expenditures in Hungary, the Czech Republic and Poland (2006=100). Source: Authors’ own analysis of HBS data.
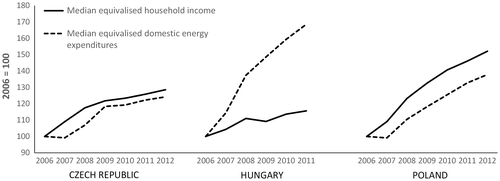
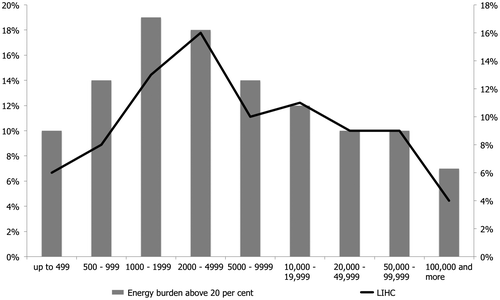
Figure 3. Percentages of households with an energy burden above 20%. Source: Authors’ own analysis of HBS data.
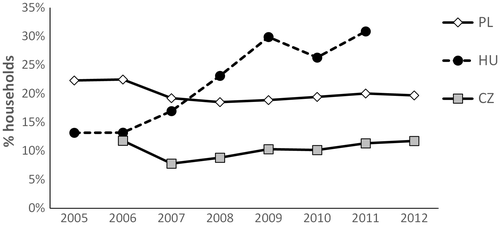
Figure 4. Percentages of households in the LIHC category. Source: Authors’ own analysis of HBS data.
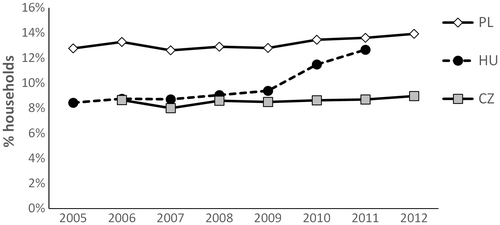
Figure 5. Percentages of people with self-reported thermal comfort and utility bill payment difficulties. Source: Authors’ own analysis of SILC data.
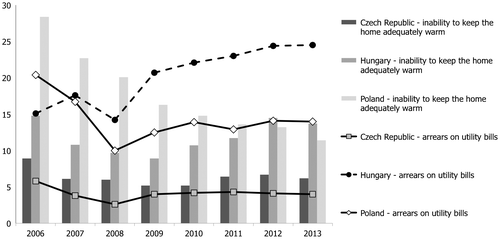
Figure 6. Percentages of people living in a dwelling that is uncomfortably cool during summer. Source: SILC ad hoc module on housing conditions (only for 2007 and 2012).
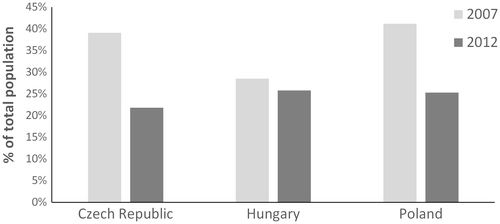
Table 1. Socio-demographic indicators of vulnerability to energy poverty. In the table, ‘category’ refers to the share of households who are considered vulnerable to the given indicator within the specific socio-demographic category; ‘total’ refers to the cumulative share of households in the sample (i.e. as a proportion of all households) who are considered vulnerable to the given indicator. Above-average values of the ‘category’ shares are italicised.
Table 2. Energy poverty indicators for selected demographic groups in Poland (expressed as shares of households in the relevant category within all households). Above-average values are italicised.
Table 3. Energy poverty indicators for selected demographic groups in the Czech Republic (expressed as shares of households in the relevant category within all households). Above-average values are italicised.
Table 4. Housing-related indicators of vulnerability to energy poverty. In the table, ‘category’ refers to the share of households who are considered vulnerable to the given indicator within the specific socio-demographic category; ‘total’ refers to the cumulative share of households in the sample (i.e. as a proportion of all households) who are considered vulnerable to the given indicator. Above-average values of the ‘category’ shares are italicised.
Table 5. Energy poverty indicators for selected housing typologies in Hungary (expressed as shares of households in the relevant category within all households). Above-average values are italicised.
Table 6. Energy poverty indicators for selected housing typologies in Hungary (expressed as shares of households in the relevant category within all households). Above-average values of the ‘category’ shares are italicised.
Figure 7. Regional variation in the shares of households who experienced energy burdens above 20%. Source: Authors’ own analysis of 2012 Czech, 2012 Polish and 2011 Hungarian HBS data.
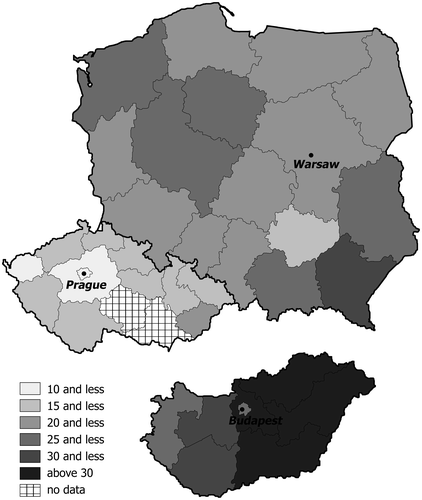
Figure 8. Regional variation in the shares of households who were energy poor according to the LIHC indicator. Source: Authors’ own analysis of 2012 Czech, 2012 Polish and 2011 Hungarian HBS data.
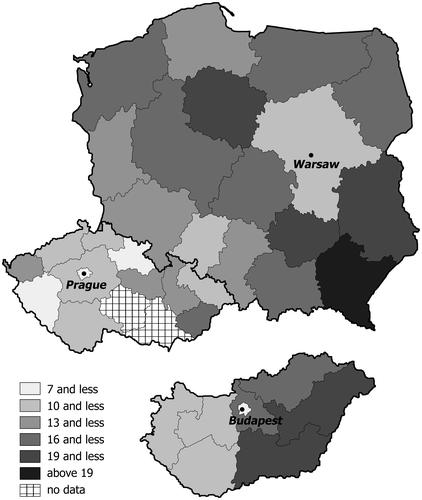
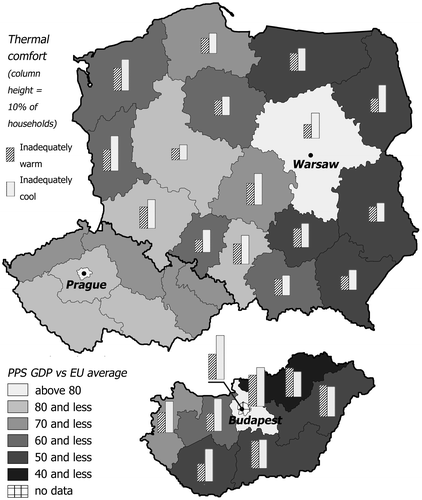
Figure 9. Regional variation in the shares of households who experienced inadequately warm or cool homes, mapped against PPP-adjusted GDP per capita figures. Thermal comfort data are not available for the Czech Republic. Source: Authors’ own analysis of 2012 Czech, 2012 Polish and 2011 Hungarian HBS data.
