Figures & data
Table 1. Analysed documents.
Table 2. Discursive categories with examples.
Figure 1. RES sector in Kazakhstan, 2010–2019.
Source: Authors’ own elaboration based on data from KazStat (Citation2021).
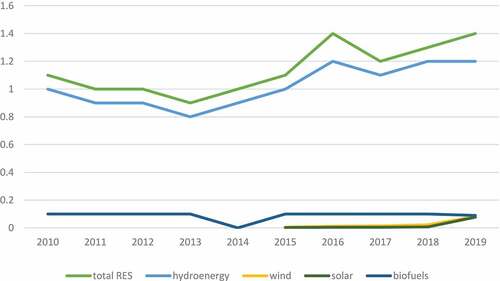
Figure 2. GHG emissions in Kazakhstan, 1990–2018.
*GHG emissions, thousands of tons of CO2 equivalent.
Source: Authors’ own elaboration based on data from the Ministry of Ecology, Geology and Natural Resources of the RK (Citation2020, pp. 37–38).
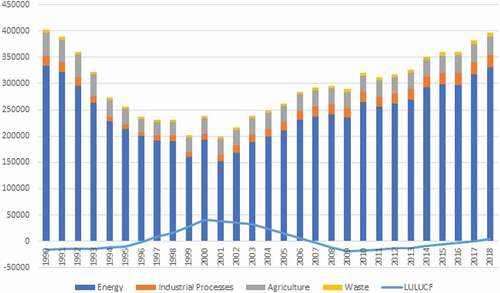
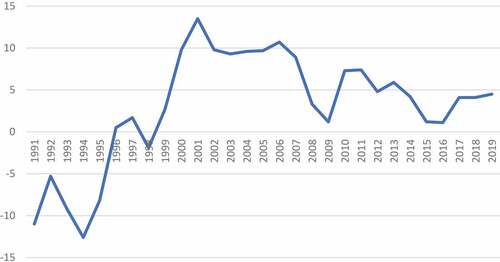
Figure 3. Economic Growth in Kazakhstan, %GDP, 1991–2019.
Source: Authors’ own elaboration based on data from the World Bank group (n.d.).