
Figures & data
Table 1. Variable description and data sources.
Table 2. Descriptive statistics of return series.
Table 3. Estimates of the cDCC-GARCH multivariate model.
Figure 1. Dynamic conditional correlations.
AE, EE, GB, PP, SW, GPRA and GPRT mean Alternative Energy, Energy Efficiency, Green Building, Pollution Prevention, Sustainable Water, Geopolitical Acts Index and Geopolitical Threats Index, respectively.
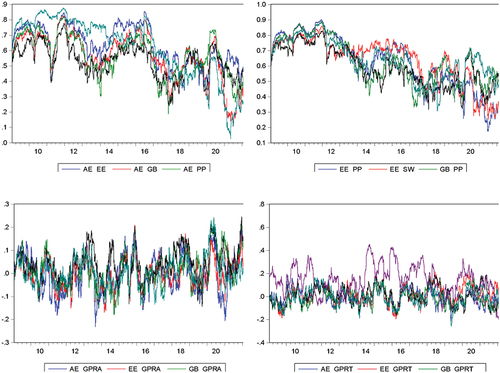
Table 4. Spillover matrix.
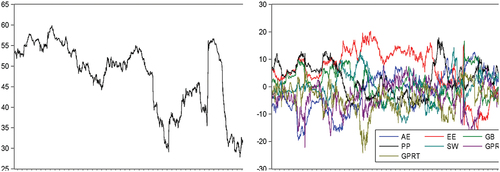
Figure 2. Dynamic connectivity.
AE, EE, GB, PP, SW, GPRA and GPRT mean Alternative Energy, Energy Efficiency, Green Building, Pollution Prevention, Sustainable Water, Geopolitical Acts Index and Geopolitical Threats Index, respectively.
Data availability statement
The data that support the findings of this study are available from the corresponding author, [P.F.], upon reasonable request.
