Figures & data
Table 1. Eligibility Criteria.
Figure 1. PRISMA study selection flow diagram.
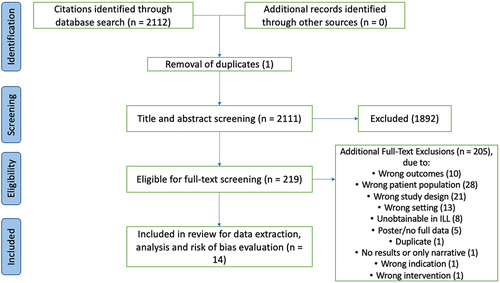
Table 2. Characteristics of included studies.
Table 3. Risk of bias assessment.
Figure 2a. Forest plot: Overall MSK and NCD comorbidities with indications of overall risk of bias per study.
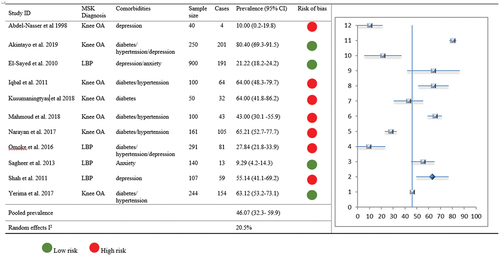
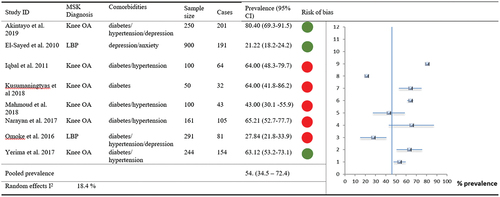
Figure 3. Forest Plot: MSK prevalence with comorbid Hypertension with indications of overall risk of bias per study.
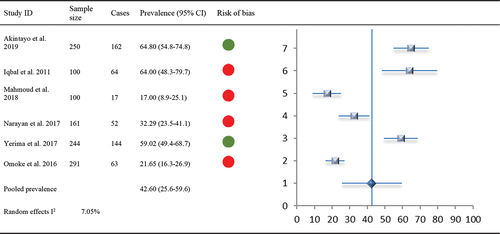
Figure 4. Forest Plot: MSK prevalence with comorbid Diabetes with indications of overall risk of bias per study.
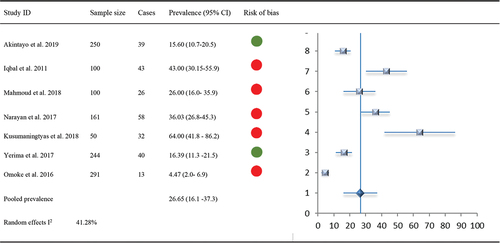
Figure 5. Forest Plot: MSK prevalence with comorbid Depression and Anxiety with indications of overall risk of bias per study.
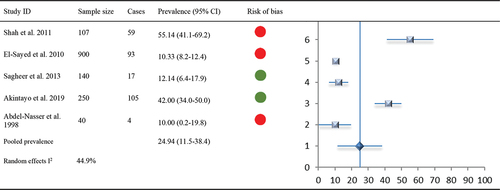
Figure 6. Forest Plot: Subgroup analysis of comorbid NCDs with specific MSK Pain (i.e. hip/knee OA and LBP) with indications of overall risk of bias per study.
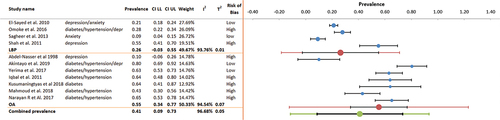
Figure 2b. Forest plot: Overall MSK and NCD comorbidities (>2).