
Figures & data
Figure 1. The basic interface of COLDSTORE at the start of the task. Participants press the + and – arrows in the Controller Input box to adjust the temperature in the ‘cold room’. The Target Value (+4 °C) is the target temperature to be reached (fixed). The Current Value depicts the actual (current) temperature. Reprinted with permission from Signaptic (Signaptic Research).
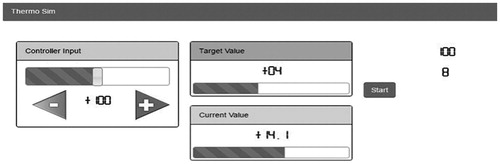
Figure 2. Examples of the four strategy types in COLDSTORE: (1) Adaptor, (2) Cautious, (3) Changer, and (4) Oscillator. Pilot’s control inputs are depicted by the line over the light-shaded area. The temperature responses by the line over the dark-shaded area. The x axis depicts the number of cycles registered (from 0 to 89). The y axis depicts the degrees in Celsius and the percentage difference from 0.
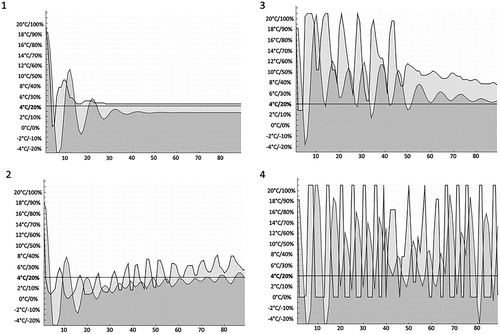
Table 1. Strategy profiles and success rate distribution.
Table 2. Strategy profiles and success rate distribution excluding the non-successful group.
Table 3. Rate how well do you think you performed in this task (1–10).