
Figures & data
Table 1. Stimulation characteristics and cycle outcomes.
Figure 1. Bar graphs comparing (i) the mean number of oocytes used in treatment; (ii) the mean number of day 3 embryos available for transfer; and (iii) the number of embryos transferred for (i) egg sharers; (ii) standard IVF patients; (iii) egg share recipients; (iv) non-egg share recipients. One-way ANOVA tests were conducted to investigate statistical significance. All data is represented as mean ± SD.
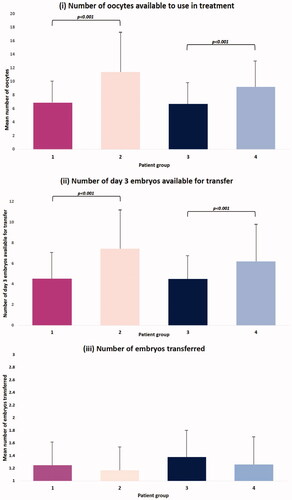
Figure 2. Graphs demonstrating the fertilisation rate and implantation rate between (i) egg sharers; (ii) standard IVF patients; (iii) egg share recipients; (iv) non-egg share recipients. Analysis was performed using Pearson’s chi-squared test. No comparisons reached statistical significance.
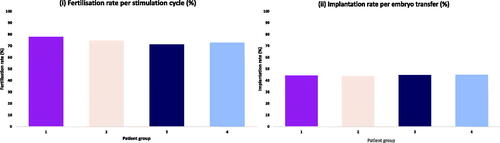
Figure 3. A series of graphs showing the different pregnancy outcomes between (i) egg sharers; (ii) standard IVF patients; (iii) egg share recipients; (iv) non-egg share recipients. Analysis was performed using Pearson’s chi-squared test. Statistically different results were identified in LBR between egg sharers and egg share recipients (p < 0.001) and in CLBR between egg sharers and egg share recipients (p < 0.05), and egg share recipients and non-egg share recipients (p < 0.001).
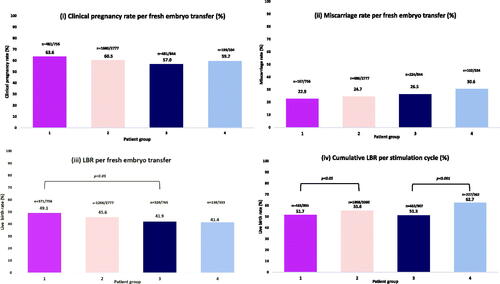
Table 2. A table comparing the numbers of oocytes collected by egg-sharers in stimulation cycles (n = 756), according to different minimum theoretical thresholds.