
Figures & data
Table 1. Summary statistics for local authorities in England (N = 315).
Figure 1. Clinics location by IVF provision.
a. Clinics location in England with regional and local authority district boundaries.
b. Clinics location by IVF provision in London with local authority district boundaries
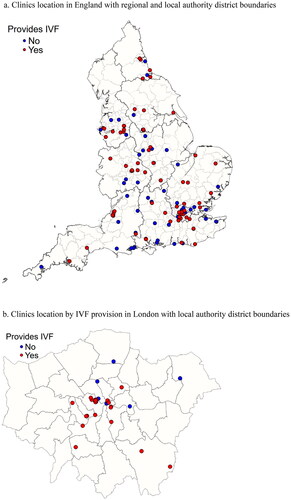
Figure 2. Clinics rate within 25 km per 10,000 women aged 18-50.
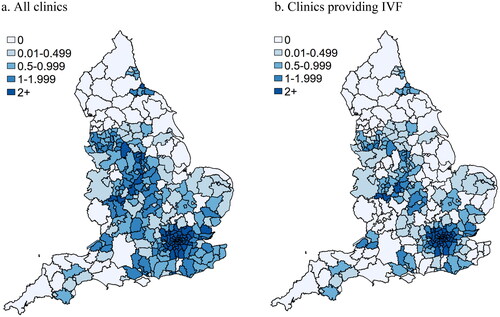
Figure 3. Clinics rate within 25 km per 10,000 women aged 18-50, weighted by the volume of IVF provision.
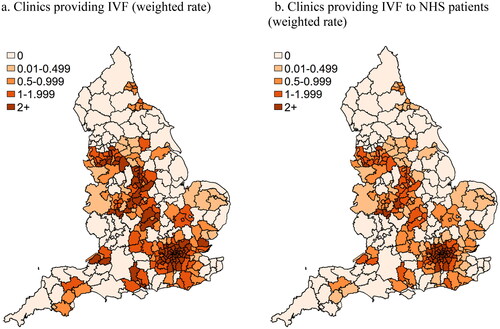
Table 2. Negative binomial regression model for fertility clinics within a range of 25 km (incidence rate ratios) a.