
Figures & data
Table 1. PICO framework.
Figure 1. PRISMA flow diagram.
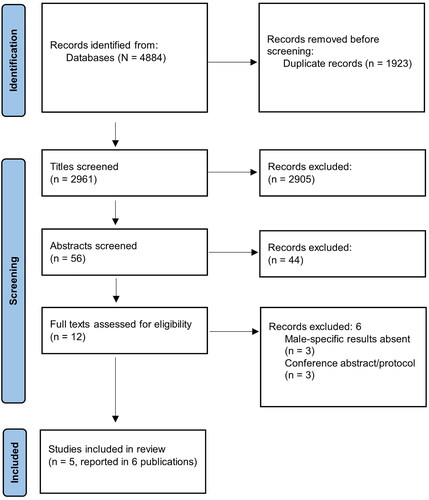
Table 2. Study characteristics of the included studies.
Figure 2. Percentage and significance of the change in participants’ fertility knowledge from baseline to follow up.
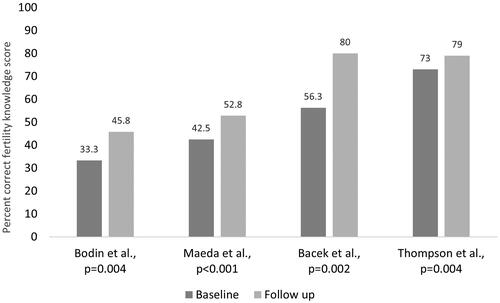
Table 3. Mean number of fertility-related risk factors identified at baseline and follow-up.
Supplemental material
Supplemental Material
Download MS Word (14.3 KB)Supplemental Material
Download MS Word (13.8 KB)Data availability statement
Data are underlying this review will be shared on reasonable request made to the corresponding author.