
Figures & data
Figure 1. Schematic study design. Both testsosterone and androstenedione levels were assayed at diagnosis (sample 0), after chemotherapy completion (sample 6), after 1-year (sample 8) and 2-year (sample 9) follow-up post-chemotherapy. CT, chemotherapy.
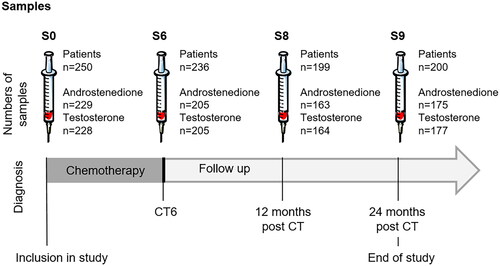
Table 1. Demographic, histological and treatment characteristics.
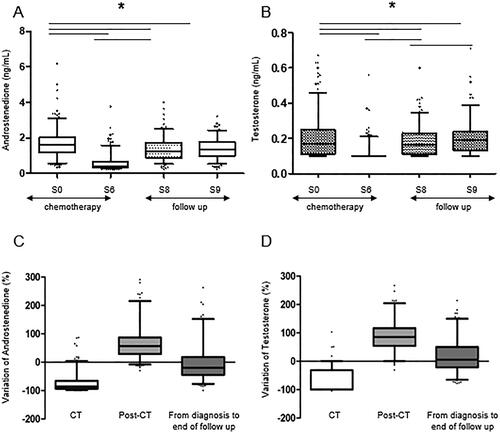
Figure 2. Evolution and relative variation of serum androstenedione (A,C) and total testosterone levels (B,D) during chemotherapy and 24-month follow-up after chemotherapy completion. *:p < 0.05.
Supplemental material
Supplemental Material
Download MS Word (81.5 KB)Supplemental Material
Download TIFF Image (15.4 KB)Data availability statement
Data can be made available upon reasonable request, after evaluation by the corresponding author.