
Figures & data
Figure 1. Representative images of histology (A) and immunofluorescence with DDX4/VASA (B) used for spermatogonial and Sertoli cell quantification. White stars and black arrows in figure A depict spermatogonia and Sertoli cells, respectively. Scale bar in A represents 100 µm; in B represents 50 µm.
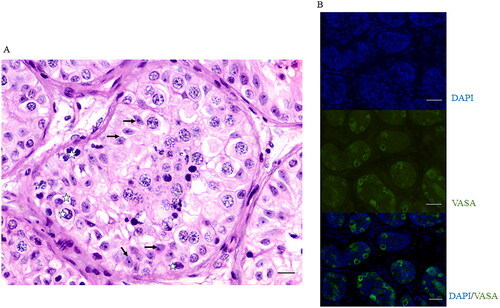
Table 1. Type of cancer and testicular cell quantities in study subjects.
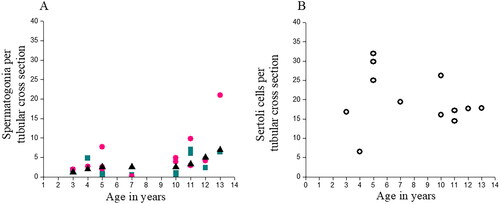
Figure 2. Spermatogonial and Sertoli cells in immature testicular tissue of prepubertal boys according to age. (A) Comparison of Spermatogonia per tubular cross-section (S/T) between the two methods of scoring, according to age, with that of the established reference values. Cyan coloured squares represent number of S/T through H&E staining, pink circles represent number of S/T through DDX4/VASA immunostaining and the black triangles represent the normative values established in healthy prepubertal boys. No statistical significance was seen between the methods of scoring, according to age. (B) Sertoli cells per tubular cross section in the study subjects showed no statistical significance according to age.
Data availability statement
Data can be made available on request.