Figures & data
Table 1. Conservative orientations towards planning and development in England.
Figure 1. Robert Fidler’s house before the removal of straw bales. Source: Reigate & Banstead Borough Council.
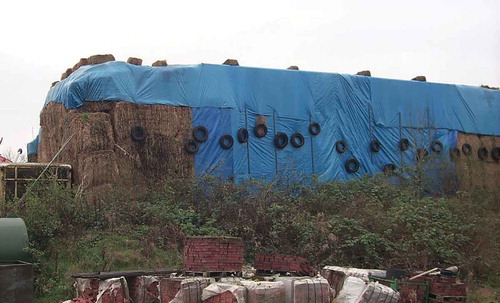
Figure 2. Robert Fidler’s house after the removal of straw bales. Source: Reigate & Banstead Borough Council.
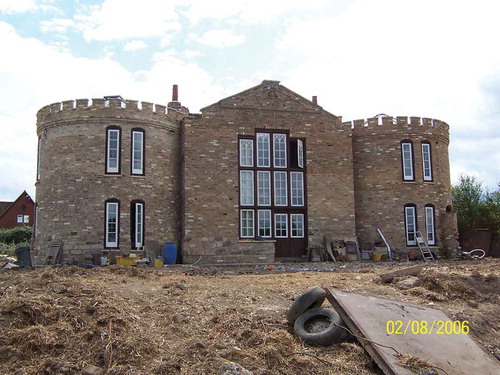
Figure 1. Division of ideology in U.S. by age (Percent of Age Group).
Source: Drawn by authors from data in Pew Research Center (Citation2014, online supplement).
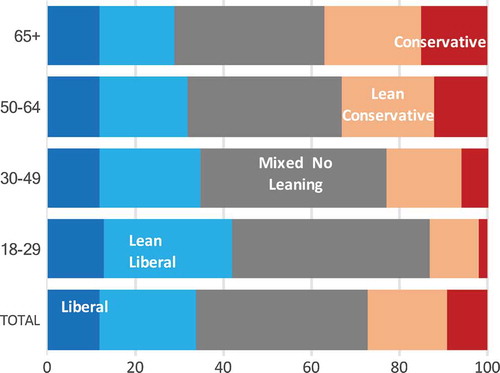
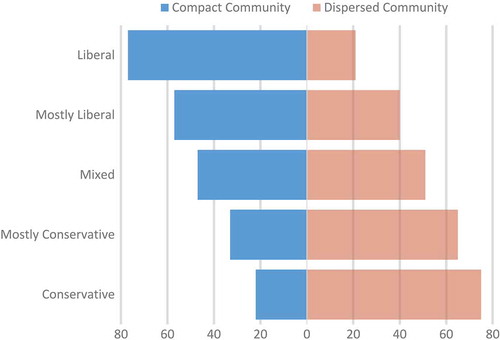
Figure 2. Preference in U.S. for compact or dispersed community, by political ideology (Percent of Each Political Leaning Group).