Figures & data
figure 1 Map showing the geographic distribution of 764 respondents in Turkey (16 respondents participated in the study from abroad).
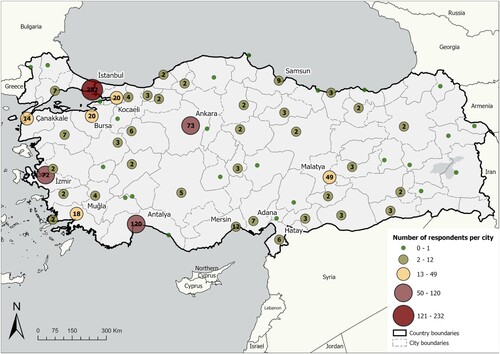
figure 2 Chart showing the representation of different religious and belief groups among the respondents.
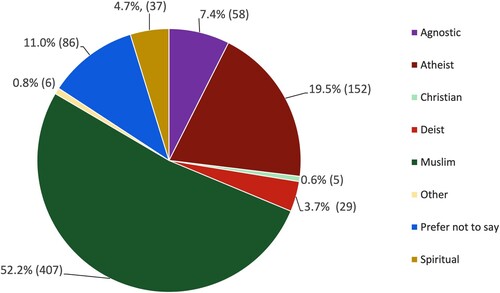
figure 3 Graph showing the overall approval rates of respondents for the display of human remains in museums.
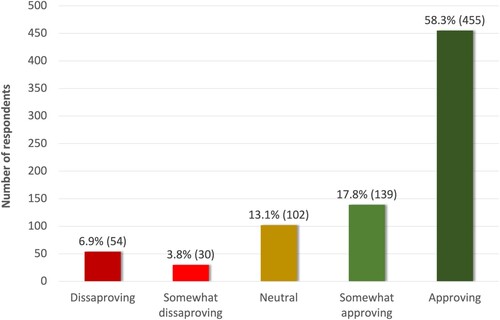
figure 4 Approval rates for the display of human remains (per age group).
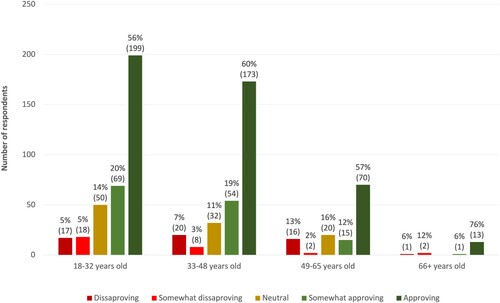
figure 5 Graph showing a comparison of the approval rates for the display of human remains from Turkic periods (Seljuk and Ottoman) and pre-Turkic periods (including prehistoric, Roman, Byzantine).
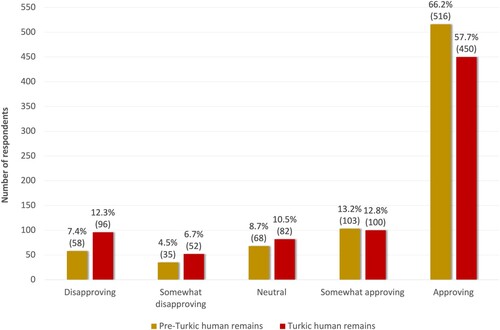
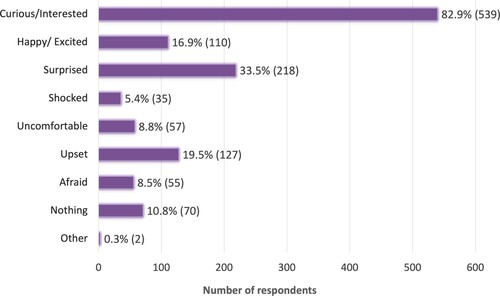
figure 6 Graph showing the range of emotions felt by respondents when they viewed human remains in museums.