
Figures & data
Figure 1. Patient disposition
aSome patients had more than one reason for exclusion from the safety analysis population. CRF: case report form.
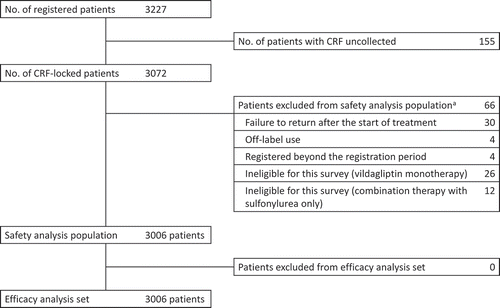
Table 1. Patient baseline characteristics
Table 2. Summary of adverse events observed in ≥5 patients
Table 3. Summary of risk management plan-related ADRs
Figure 2. Changes in HbA1c over time from baseline to endpoint
αGI: α-glucosidase inhibitor; BG: biguanide; GND: rapid-acting insulin secretagogue (glinide); HbA1c: glycated hemoglobin; INS: insulin; Met: metformin; NGSP: National Glycohemoglobin Standardization Program; SD: standard deviation; TZD: thiazolidine derivative.
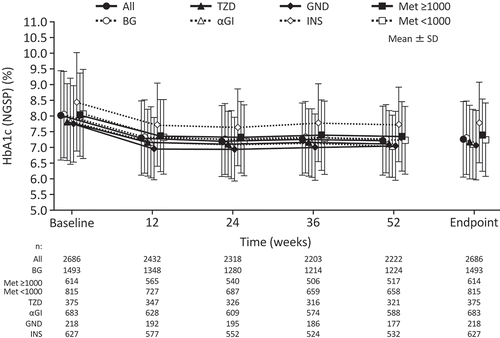
Table 4. Change in HbA1c from baseline stratified by concomitant antidiabetic medication
Table 5. Mean change in HbA1c over time stratified by patient characteristics
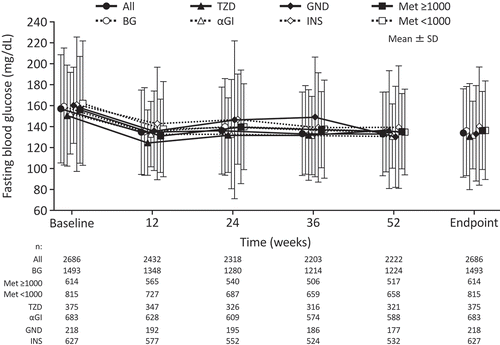
Figure 3. Mean change in fasting blood glucose over time from baseline to endpoint
αGI: α-glucosidase inhibitor; BG: biguanide; GND: rapid-acting insulin secretagogue (glinide); INS: insulin; Met: metformin; SD: standard deviation; TZD: thiazolidine derivative.
Supplemental material