
Figures & data
Figure 1. Study design diagram.
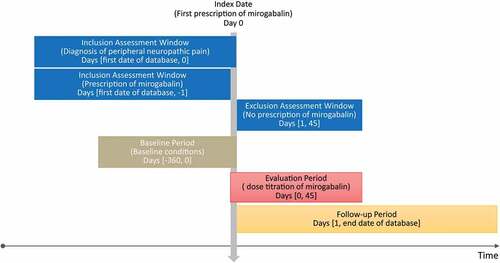
Figure 2. Flow chart of study patients.
Table 1. Baseline and clinical characteristics.
Table 2. Distribution of dose titration pattern of mirogabalin.
Table 3. Univariate logistic regression for evaluating dose titration pattern and adherence of mirogabalin.
Figure 3. Multivariable logistic regression for factors associated with mirogabalin adherence. Dose titration was evaluated as titrated and non-titrated using the prescribed initial and subsequent doses. Dose titration to effective dose was evaluated as titrated, non-titrated, and undefined: titrated if the dose titration follows recommended regimen; undefined if the prescribed initial dose were higher than the recommended initial dose; non-titrated otherwise. The initial dose pattern was classified as high, low and regular: regular if the prescribed initial dose was within the recommended range; high if it was higher; and low if it was lower. Arrow was used when values are outside the axis range.
Figure 4. Kaplan–Meier plot for non-persistence of mirogabalin. a) Dose titration within 45 days with overall patients, b) Period pattern of dose titration with overall patients, c) Dose titration throughout the entire period with overall patients, d) Dose titration to the effective dose within 45 days in patients with renal function, e) Period pattern of dose titration to the effective dose in patients with renal function, f) Dose titration to the effective dose throughout the entire period in patients with renal function.
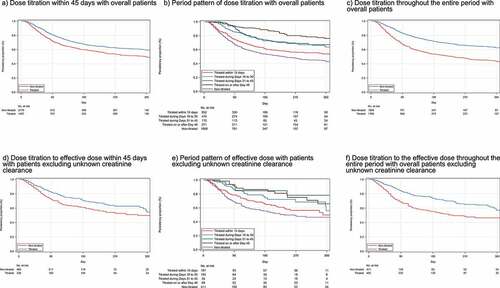
Table 4. Univariate COX regression for the association between dose titration and persistency and switching of mirogabalin.
Figure 5. Multivariable COX regression for factors associated with mirogabalin persistence. Dose titration was evaluated as titrated and non-titrated using the prescribed initial and subsequent doses. Dose titration to effective dose was evaluated as titrated, non-titrated, and undefined: titrated the dose titration follows recommended regimen; undefined if the prescribed initial dose were higher than the recommended initial dose; non-titrated otherwise. The initial dose pattern was classified as high, low and regular: regular if the prescribed initial dose was within the recommended range; high if it was higher; and low if it was lower. Arrow was used when values are outside the axis range.
Data availability statement
Data is not available due to ethical restrictions.