
Figures & data
Table 1. Research question in PICO-format.
Figure 1. Study flow chart depicting the record identification and screening process, illustrated according to recommended reporting on systematic reviews (adopted version of Moher, Liberati, Tetzlaff, Altman, The PRISMA Group, Citation2009).
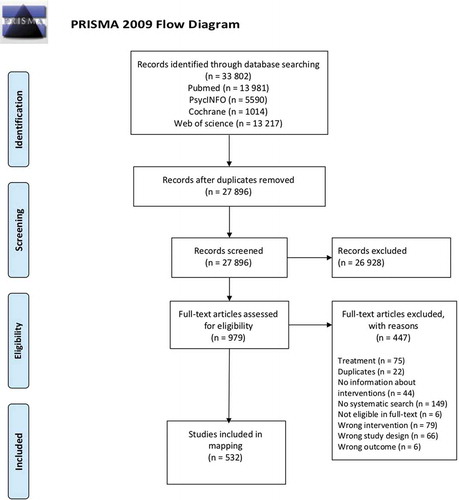
Figure 2. Overview of the number of systematic reviews identified in international databases from inception to 2017, presented by year (n=532).
Figure 3. Number of systematic reviews distributed by interventions targeting substance type. Note that one systematic review can evaluate more than one intervention targeting different substances.
Figure 4. Overview of identified categories of preventive interventions within the field of substance abuse.
Supplemental material