
Figures & data
Table 1. Descriptive information for collected data
Table 2. Premier League revenue, expenditure, and profits by year
Figure 1. Premier League profit before tax and Gross Value Added over time, Index (100 = 1993). Periods of major economic downtowns shown by shaded area (UK GVA down in dark grey, UK company profit contraction in light grey). Renewal of Premier League broadcast rights shown by vertical dotted line.
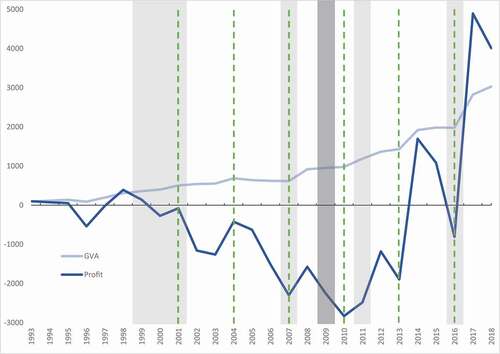
Figure 2. Resistance and recovery by club to Service Sector changes in GVA. Contraction 2009. Expansion 1999–2008, 2010–2018. N = 17.
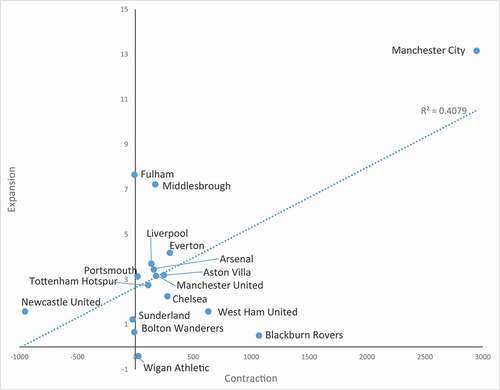
Figure 3. Resistance and recovery by club to UK changes in GVA. Contraction 2009. Expansion 1999–2008, 2010–2018. N = 17.
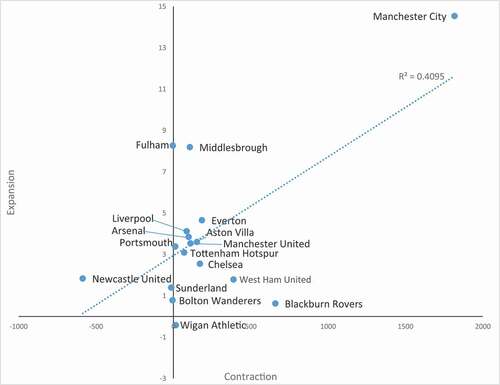
Figure 4. Resistance and recovery by club to Service Sector changes in profit. Contraction 1999–2001, 2004, 2007, 2011, 2016–2017. N = 34.
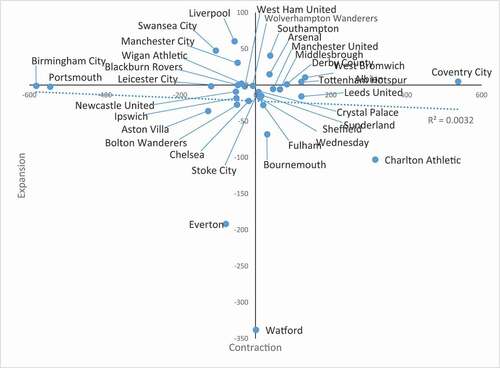
Figure 5. Resistance and recovery by club to UK changes in profit. Contraction 1999–2001, 2007, 2009, 2011, 2016. N = 31.
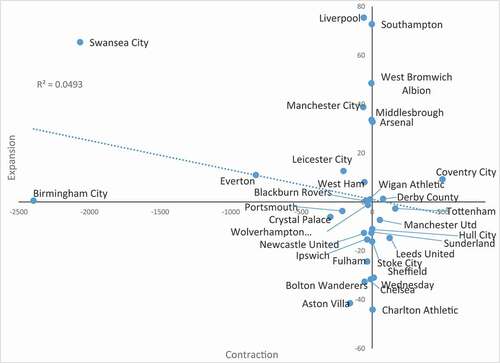
Table 3. Summary of club resilience (using profit), length of time in EPL, and owner financing
Table 4. 2018 club profits following hypothetical changes in revenue streams