Figures & data
Table 1 Subject characteristics.
Figure 1 An example of an ILD psychometric curve as described by Equation (1). The is the perceptual bias or shift in decibels, with a negative value indicating a shift towards the right or CI1 side and a positive value indicating a shift towards the left or CI2 side. In this example, a shift of −1.25 dB is shown, indicating no clear bias. The grey shaded zone indicates the width or
in decibels, which denotes the 10–90% width of the sigmoid. In this example the width is around 10 dB.
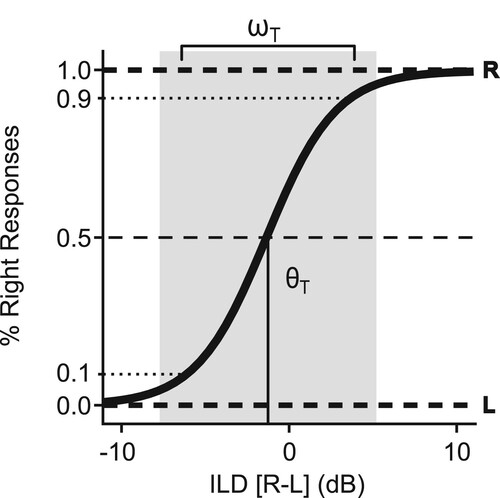
Figure 2 ILDs for the different groups and stimulus types (BB, LP, MP and HP). The normal hearing children (NH) are shown at the top (A–D), whereas the sequential (SEQ) and simultaneous (SIM) BiCI children are respectively shown in the middle (E–H) and bottom (I–L) of the figure. The grey lines within the plots describe the individual results, whereas the bold lines indicate the mean for that particular group. For the NH and SEQ groups, the mean shift (θ) and width (ω) are depicted. For the SIM children, the individual values are listed. A negative value indicates an ILD towards the right or CI1 side and a positive value indicates an ILD towards the left or CI2 side. For the children with simultaneous BiCIs, no bold line was drawn. With the exception of three children, a steep ILD curve is observed in most children with normal hearing, indicative of good ILD perception.
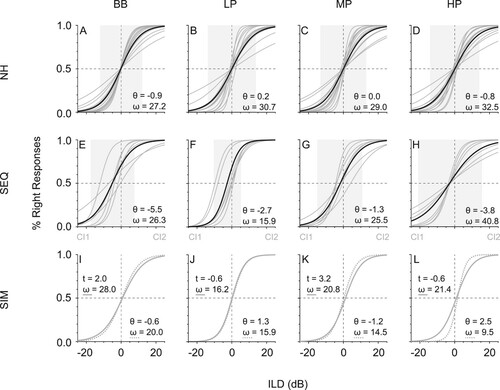
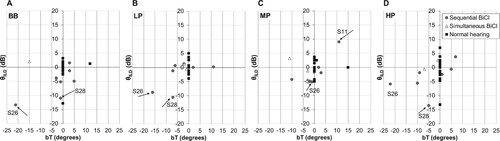
Figure 3 Scatterplot of ILD width (ωILD) against shift (θILD) for the different groups and stimulus types. A negative shift corresponds with a shift towards the right or CI1 side and a positive shift is a shift towards the left or CI2 side. No significant difference in ILD width between groups was found (p > .05). Compared to the children with normal hearing, children with sequential BiCIs showed a significant larger shift towards the CI1 side for the BB stimulus (A), but not for the other stimulus (p < .05).
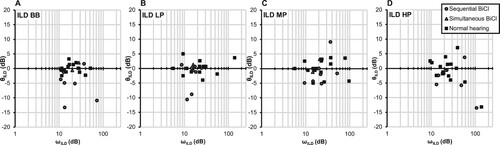
Figure 4 Scatter plot with inter-implant delay depicted against ILD shift (θILD) for the children with BiCIs. There is a significant negative correlation between inter-implant delay and the ILD shift for both the BB and the HP stimulus.
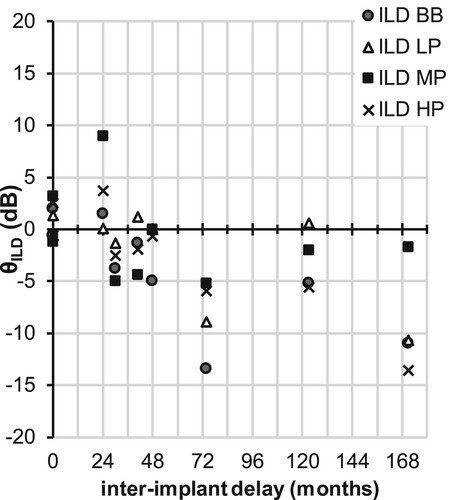
Figure 5 Scatterplot of ILD shift (θILD) against the target bias (bT) in localization for the different groups and stimulus types. In this Figure can be seen that when a shift in ILD is higher than 5 dB to the CI1 or CI2 side for the children with BiCIs, this shift is also seen in localization for S26 and S11, but not for S28.