Figures & data
Table 1 Walk in sound processor configuration for study cohort
Table 2. Speech perception testing schedule at the first appointment in the clinic and after 3–5 weeks take home experience with the Kanso 2 sound processor.
Figure 1 Test set up with loudspeaker locations. Left figure shows testing for the speech signal in quiet from the front (S0); Middle figure shows the speech signal from the front and 4-talker babble noise from 3 speakers (i.e. 12-talker babble), from both sides and rear (S0N3). Right figure shows the speech from thefront and 4-independent talkers presented from four locations (e.g. from speakers 1,3,5 and 6 shown) roving across 7-speakers in the rear hemi-field (S0Nrearhemi).
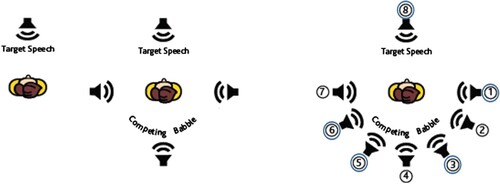
Figure 2 Whisker plots for distribution of speech reception thresholds (dB SRT50%) for the group in the 12-talker babble test condition (S0N3) with mean and 95% confidence intervals shown below each, measured during the Acute test phase with the Kanso 2 sound processor, with the zoom microphone setting, and ForwardFocus On versus ForwardFocus Off for the group (N = 22). All subjects were tested in the unilateral listening condition.
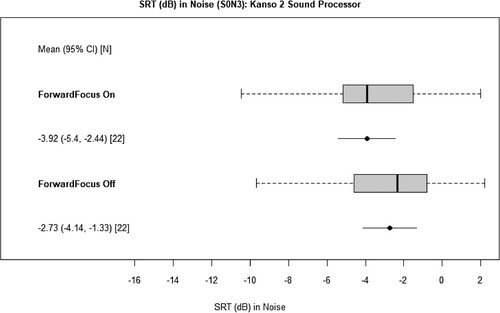
Figure 3 Whisker plots of the distribution of speech reception thresholds in four independent talkers babble roving from the rear hemi-field (S0Nrearhemi) with mean and 95% confidence intervals shown below, after the take-home trial phase (n = 20). The top plot shows the Kanso 2 sound processor with ForwardFocus On. The bottom plot shows the Nucleus 7 sound processor with ForwardFocus On. The 13 bilaterally implanted subjects were tested with their daily use bilateral sound processor configuration and the seven unilaterally implanted subjects were tested in a unilateral sound processor configuration.
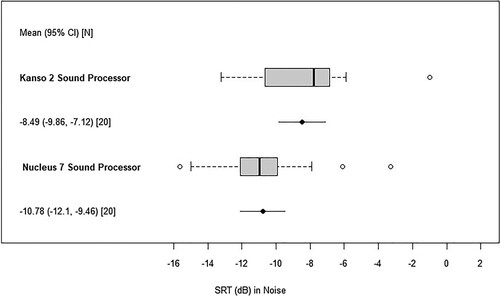
Figure 4 Whisker plots show the distribution of group scores for percent correct word scores in quiet at 60 dB SPL (top) and 50 dB SPL (bottom), with mean and 95% confidence intervals indicated below each, after the take-home trial phase (N = 20). All subjects were tested in the unilateral listening condition.
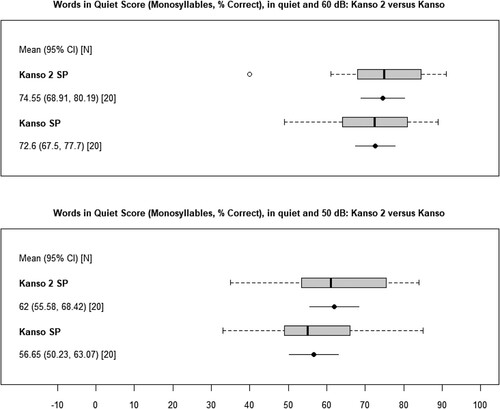
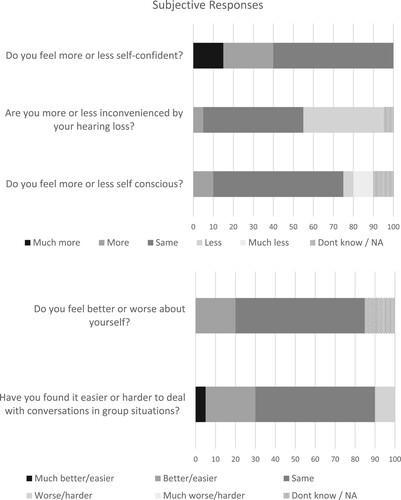
Figure 5 Percentage of subjects giving each response rating via the Sound Processor Experience Questionnaire, comparing Kanso 2 sound processor to their walk-in sound processor in their daily listening configuration, following the take-home trial phase, N = 20.