
Figures & data
Figure 1 Top left: Cochlea and cochlear implant components. Top right: Fused cochlea image from CBCT, CT, and MR images. Bottom: Cochlear image segmentation of μCT showing the cochlea main scalae. Scala tympani in green and both scala vestibuli and scala media in red (top: 3D view: bottom from left to right: axial, sagittal, and coronal views).
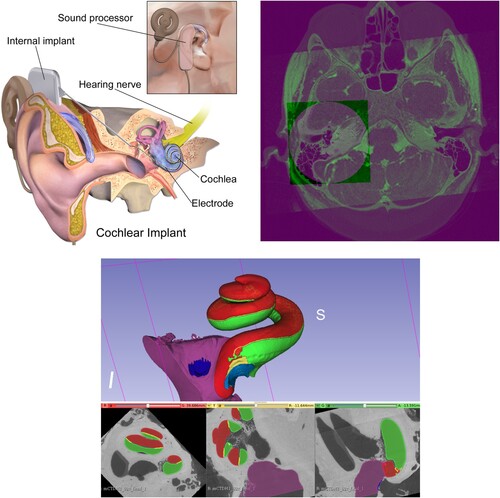
Figure 2 Top: Image registration basic components. Bottom: Atlas–model-based concept.
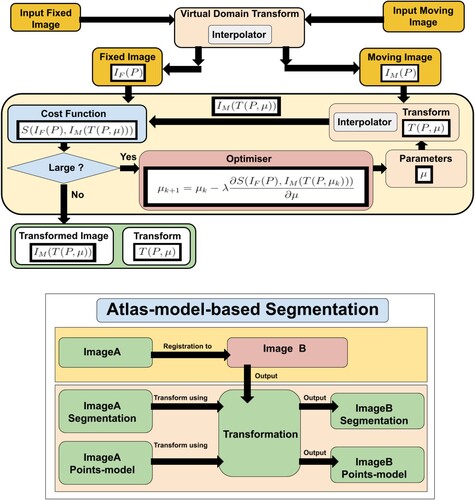
Figure 3 Cochlea A-value method. The green points (x, y) are the A-value end points, the green line shows the A-value length.
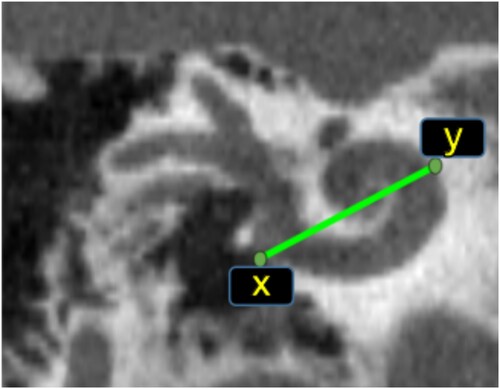
Table 1 Datasets, images used in both experiments: 108
Figure 4 Top left: Cochlea landmarks in brown colour and A-value endpoints in yellow colour. Top right: The point models of scala tympani (in yellow) and scala vestibuli (in blue) central lengths. Bottom: The point models of scala tympani, the outer points in dark green colour for measuring the lateral wall length and the inner points in dark red for measuring the organ of corti length.
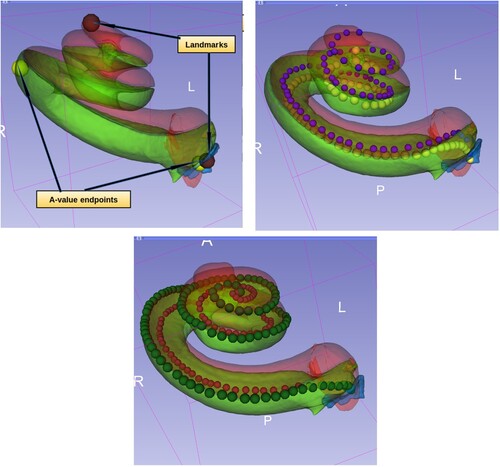
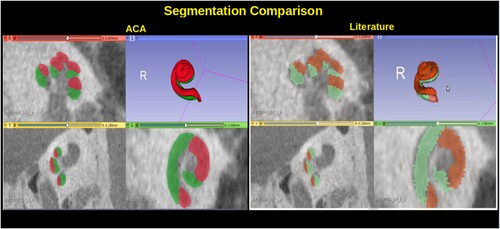
Figure 5 Cochlear segmentation using the new proposed high-resolution atlas in comparison to the low-resolution atlas proposed in ACA (Al-Dhamari et al. Citation2018).
Algorithm 1. ACA-v2
Figure 6 Sample of the results from different image types with RMSE values. In each group, the image on the left has the lowest RMSE value and the image on the right has the highest RMSE value. Each result has the 3D model at the top and the three standard views at the bottom, i.e. axial, sagittal, and coronal.
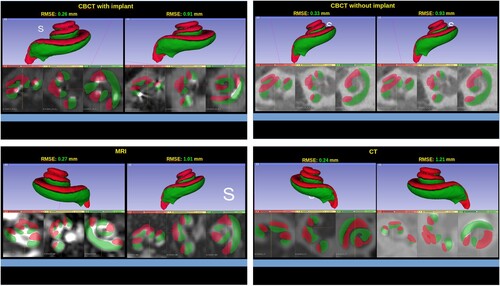
Figure 7 Sample from the results: RMSE and time charts of different image groups. CBCT after and before surgery, CT, and MR.
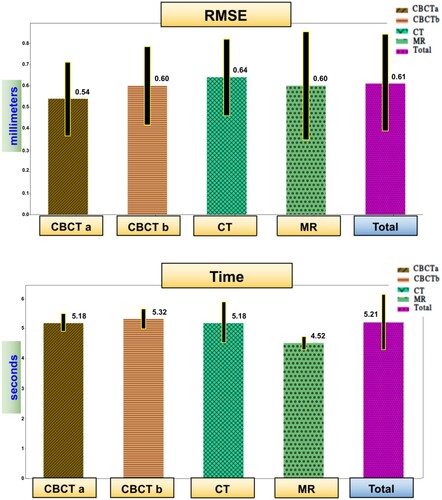
Figure 8 Sample from the results: In-Patient-Error in mm. The comparison between automatic A-value method and manual A-value method (Lt and Oc are short for lateral wall and organ of corti).
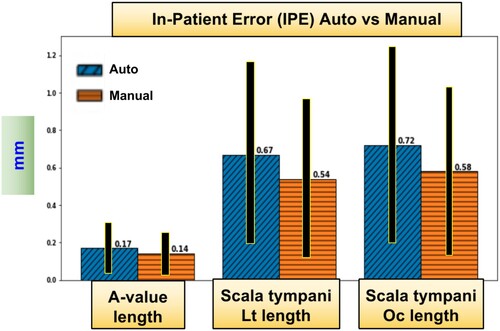
Table 2 ACA-v2 measurements with IPE
Table 3 Scala tympani length measurements with their In-Patient-Error (IPE)