Figures & data
Figure 1. D-Values of Xinjiang. D-values = (GRP per capita for a given province in a given year – the average of all provinces in China in that given year). Source: National Bureau of Statistics of China.
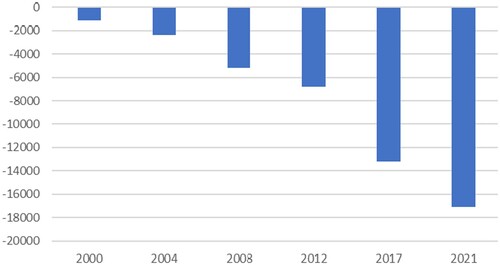
Figure 2. D-Values of the Western Economic Zone. Source: National Bureau of Statistics of China.
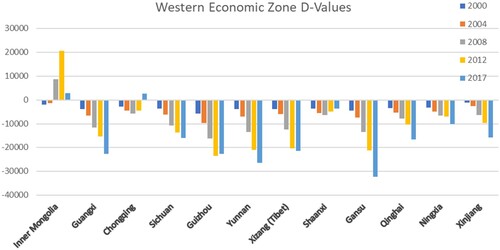
Figure 3. The ten highest-producing Chinese steel enterprises as of 2019. Source: Statista.
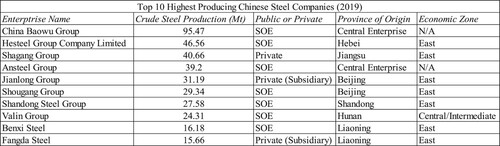
Figure 4. China’s three economic zones and the home province of China’s top ten steel enterprises.
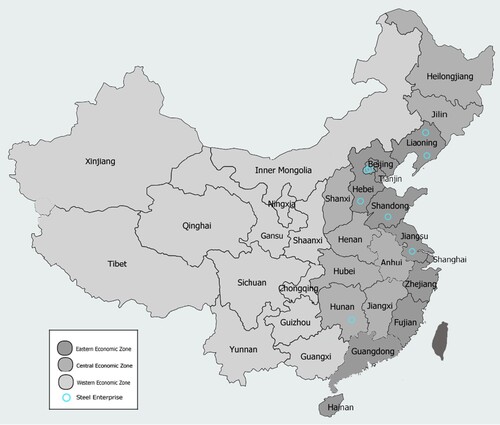
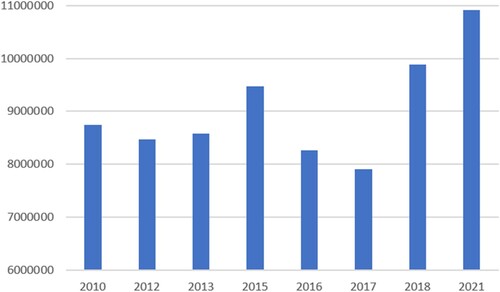
Figure 5. Ethnic Han Chinese population in Xinjiang. Source: National Census of China 2010 & 2021; China Statistical Yearbooks.