Figures & data
Table 1. Studies on the various parameters involved in the design of HAPs.
Figure 1. Thermal energy balance in HAP system.
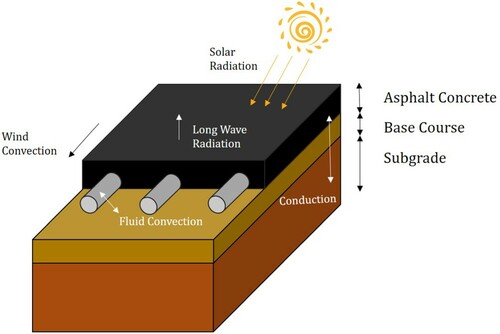
Figure 2. Domain boundary conditions.
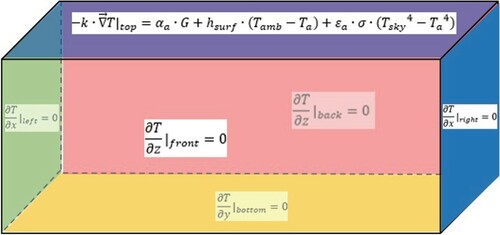
Figure 3. Temperature variation at: (a) specified depths with time; (b) continuous depths.
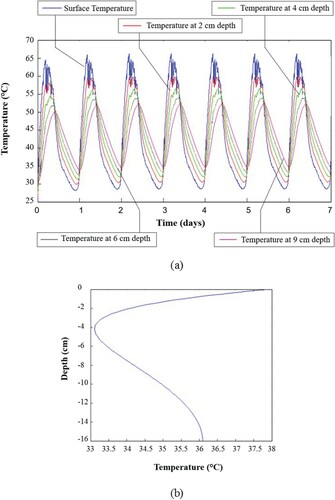
Figure 4. Comparison between measured results and FDM results at: (a) surface; (b) 1.5 cm depth; (c) 4 cm depth; and 6 cm depth.
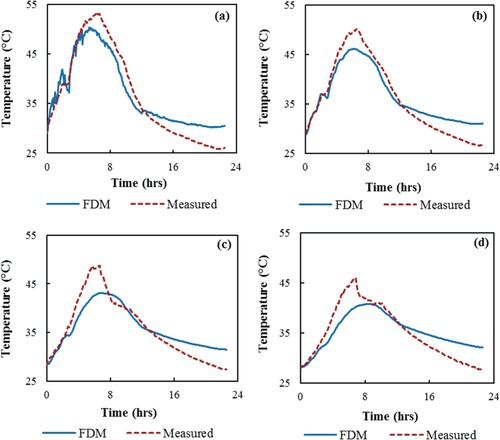
Table 2. Reference values of the conducted simulations.
Figure 5. Parametric study results.

Figure 6. Variation of surface temperature with pipe conductivity.
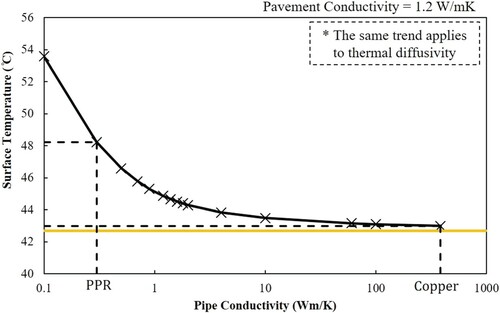
Figure 7. Effect of changing asphalt and pipe conductivities on surface temperature.
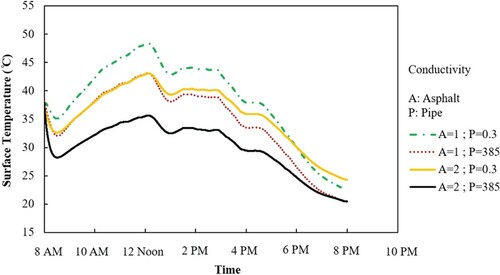
Figure 8. Effect of spacing on the cross-sectional temperature distribution.
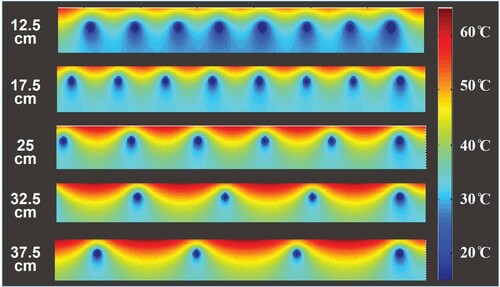
Figure 9. Effect of: (a) depth and (b) diameter on the cross-sectional temperature distribution.
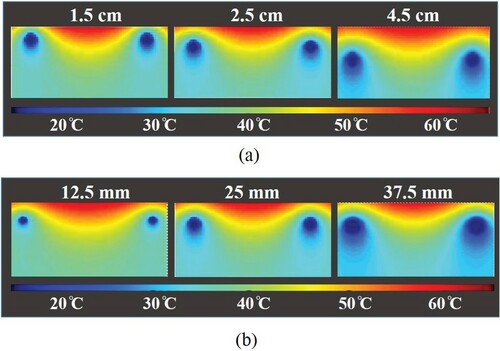
Figure 10. Evolution of surface temperature distribution with time from numerical simulation.
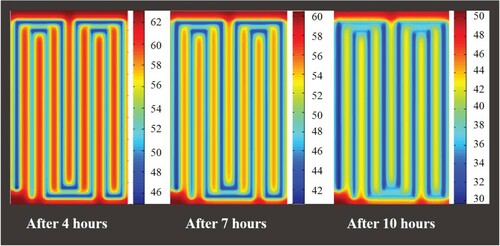
Figure 11. Surface temperature distribution at the middle of the surface section of the pavement.
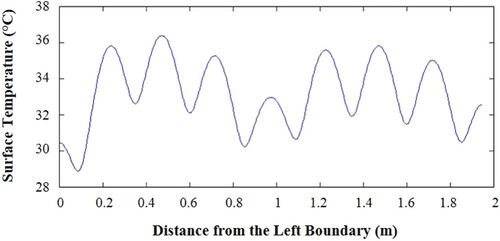
Figure 12. Effect of flow rate on the temperature difference between inlet and outlet.
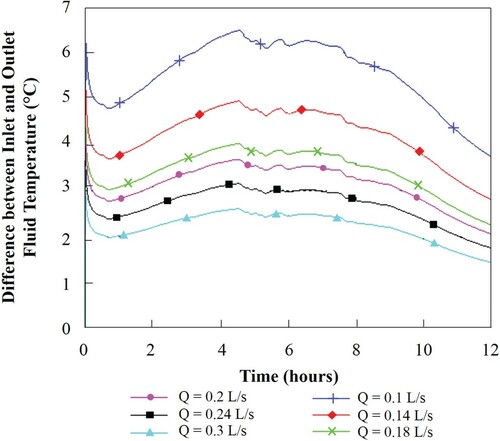
Table 3. Pilot study parameters.
Figure 13. Reverse-return configuration of pipes embedded in the asphalt layer.
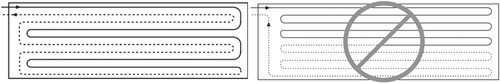
Figure 14. Schematic of three systems to be constructed.
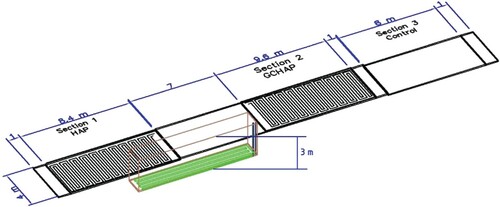
Figure 15. Gradation (NMAS 19.0 mm) of the asphalt mixture used in large-scale construction.
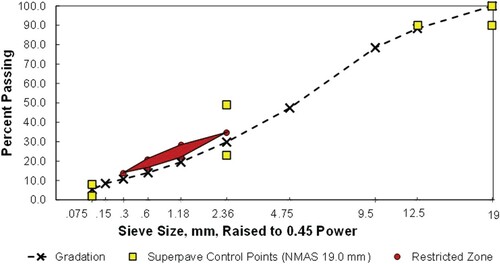
Table 4. Asphalt mix proportioning.
Figure 16. Road selected for construction of HAP, GCHAP and control sections.
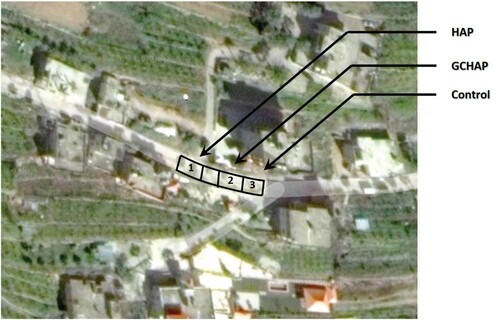
Figure 17. Solar path on 1 July 2017 over the chosen site.
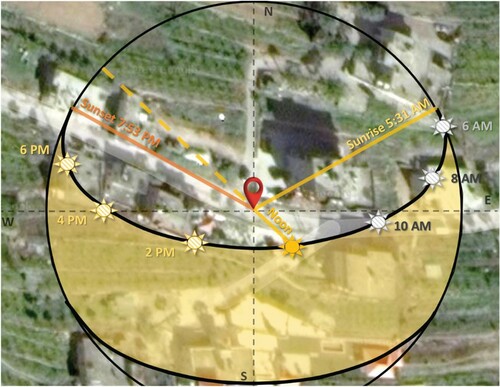
Figure 18. Road: (a) before construction; (b) during pipe placement in the asphalt layer; and (c) during pipe placement in the soil (heat sink).
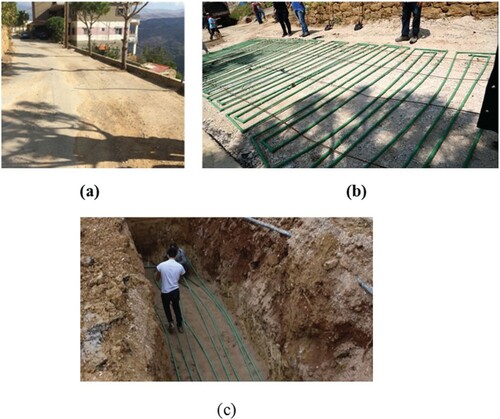
Figure 19. (a) Sensors locations on the as-built drawing; and (b) sensor placement in the asphalt layer.
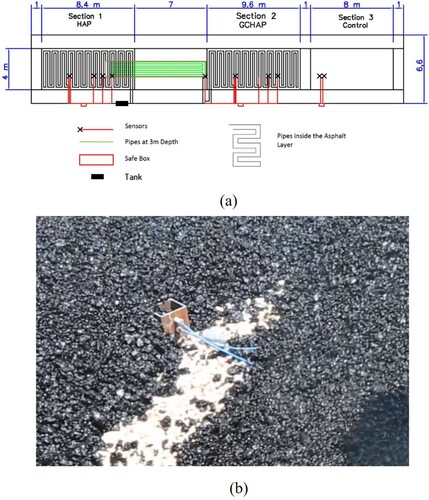
Figure 20. Temperature distribution for control section.
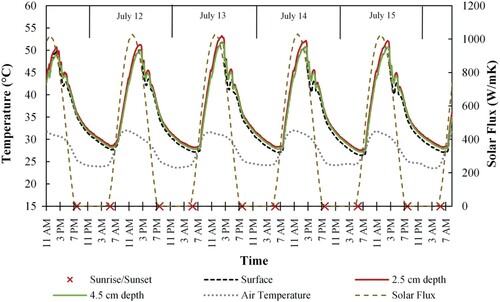
Figure 21. Temperature distribution inside the pavement for the HAP section.
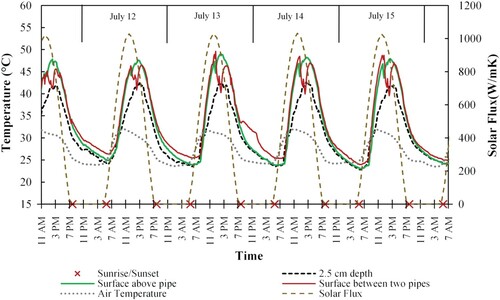
Figure 22. Heating/cooling cycle on 14 July for the HAP section.
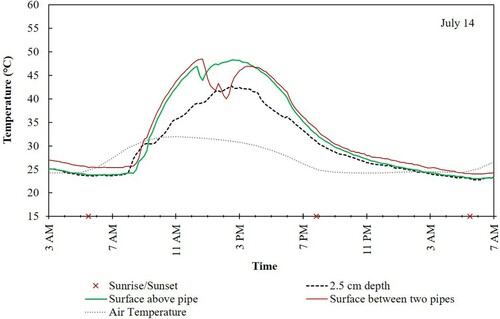
Figure 23. Temperature distribution inside pavement (GCHAP section).
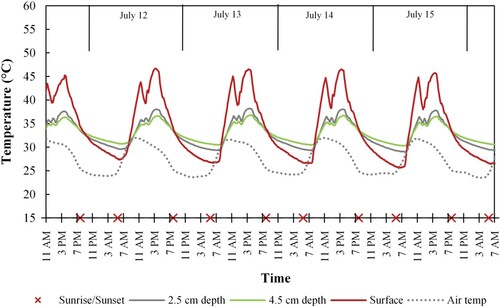
Figure 24. Heating/cooling cycle on 12 July for the GCHAP section.
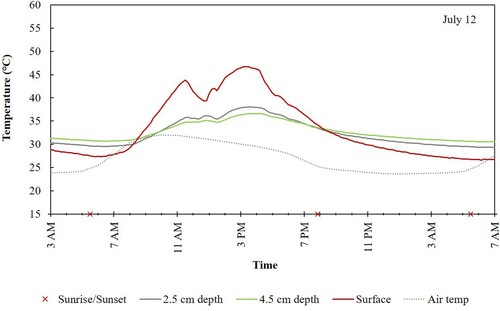
Figure 25. Comparison of performance of HAP and GCHAP in reducing surface temperature of pavement.
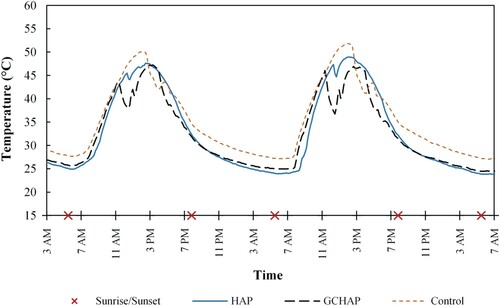
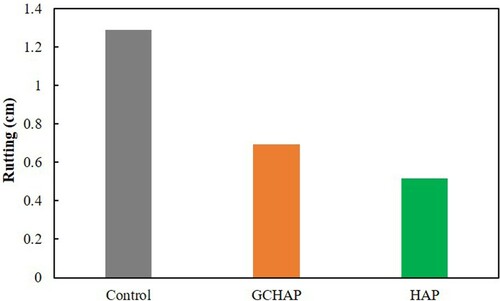
Figure 26. Rutting prediction associated with each of the three systems.