Figures & data
Figure 1. Experimental methodology.
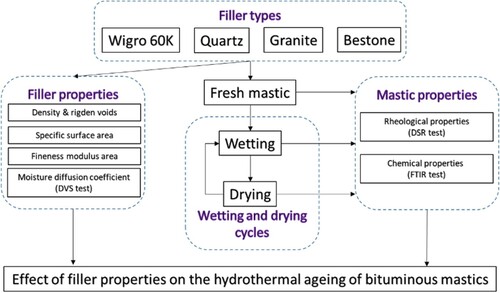
Table 1. Physical properties of mineral fillers.
Table 2. Mineralogy of mineral fillers.
Table 3. Elemental composition of mineral fillers.
Figure 2. Operation principle of the Dynamic Vapour Sorption (DVS) device. (The image is reproduced with the permission of Surface Energy Measurement Systems, London, UK).
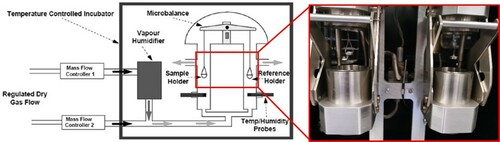
Figure 3. Kinetics of water sorption on the WG 60 K filler sample.
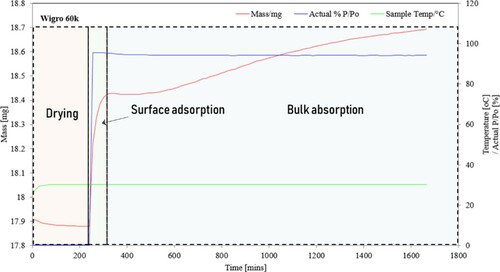
Figure 4. Dynamic shear rheometer.
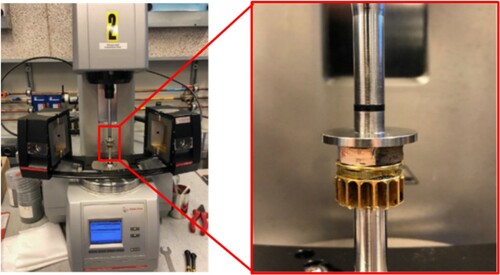
Figure 5. (a) FTIR spectrometer and (b) mastic sample on the crystal area of the FTIR-ATR top-plate.
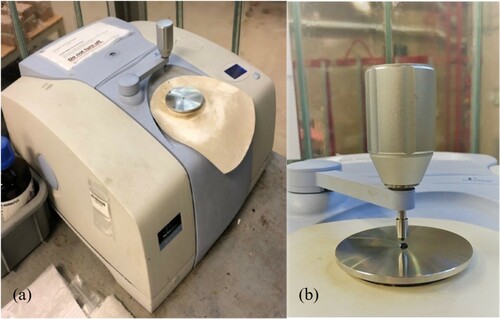
Figure 6. Normalised moisture content with time.
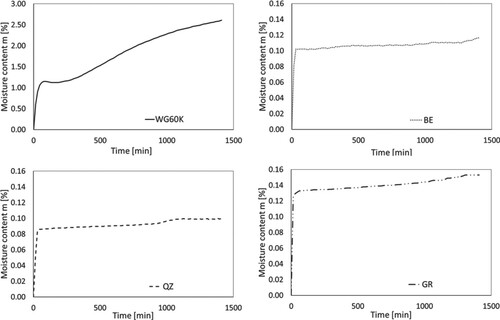
Table 4. Average particle radius and moisture diffusion coefficients of mineral fillers.
Figure 7. Master curves of bitumen and mastics at different hydrothermal conditions.
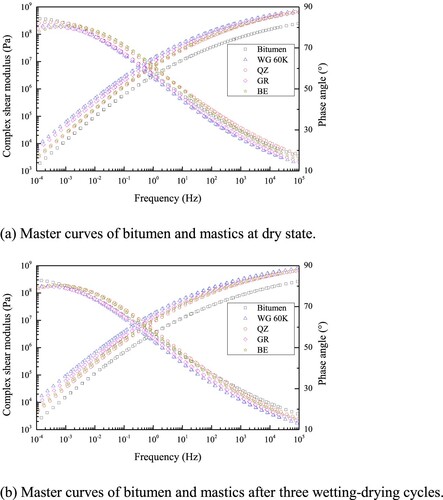
Table 5. CAM model parameters of bitumen and mastics at different hydrothermal conditions.
Figure 8. Effect of wetting-drying cycles on crossover frequency and modulus indices.
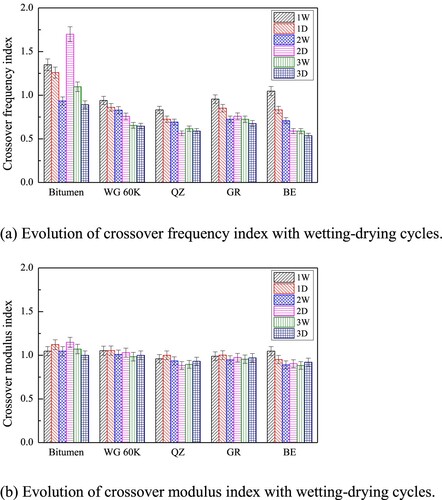
Figure 9. Change in crossover modulus (G_cros, conditioned/G_cros, fresh) and crossover frequency (f_cros, conditioned/f_cros, fresh) after three wetting-drying cycles versus the moisture diffusivity of fillers.
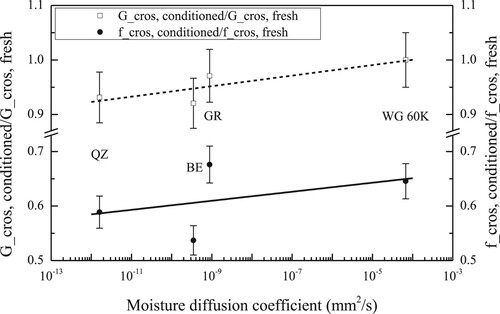
Figure 10. Changes in crossover modulus and frequency after wetting-drying cycles and their relation to the physical properties of mineral fillers.
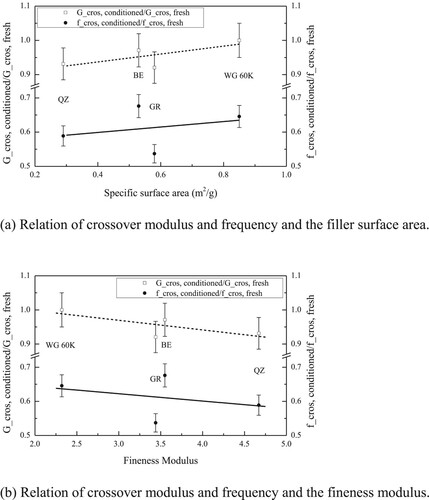
Table 6. Mean, SD and SE values of the normalised areas in water region evaluated at different conditioning states.
Figure 11. Calculated Am areas of FTIR spectra in the water absorption region of bitumen and bituminous mastics at dry (fresh) state and after each wetting or drying phase.
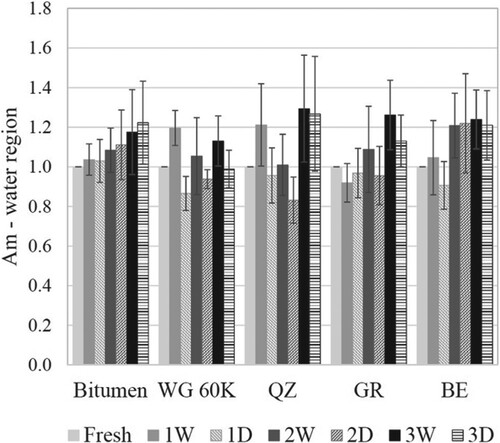
Figure 12. Average of normalised peak areas of the (a) C = O group and (b) S = O group of bitumen and bituminous mastics at fresh and after each wetting-drying cycles.
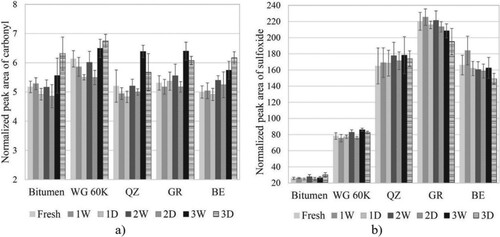
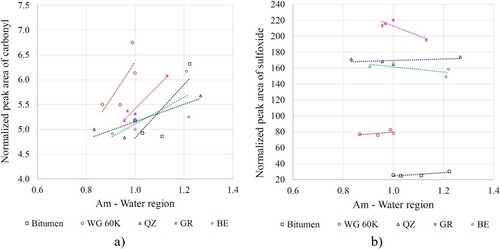
Figure 13. Evolution of the normalised peak areas of (a) carbonyl and (b) sulfoxide versus moisture content as expressed by the normalised peak area ratio Am.