Figures & data
Figure 1. Overview of the pavement sites, including the service life in years (y).
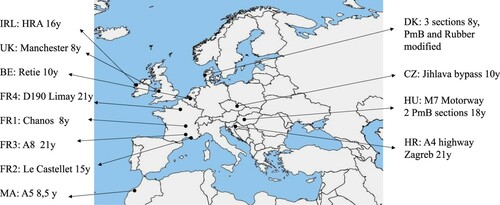
Table 1. Information of the field sections: original binder, pavement age and mix type.
Figure 2. Schematic of the slicing and some photographs of the slices before recovery.
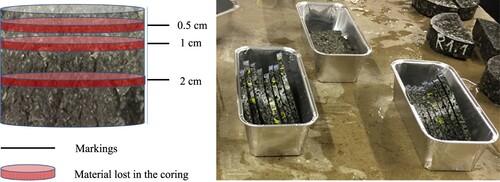
Table 2. Void contents, thickness wearing course, binder content and number of separately recovered slices for each section.
Figure 3. An example of FTIR spectra, peak integrations and the calculation of indices.
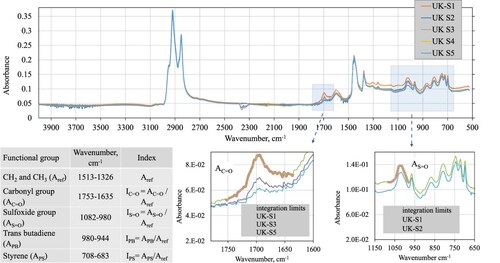
Table 3. Example of the repeatability of the FTIR indices for one site.
Figure 4. Illustration of the selection of strain levels for two binders.
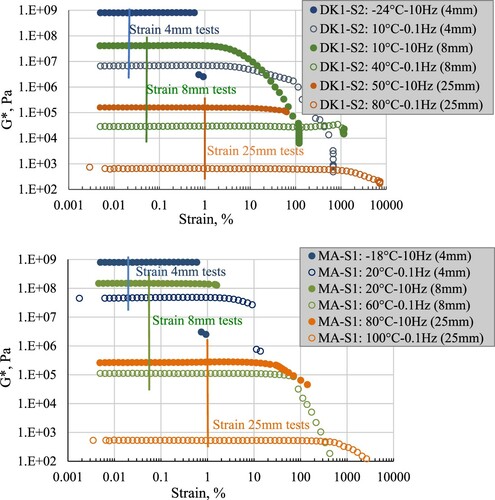
Table 4. Parameters calculated by the Rhea software (beta version 4) (Abatech).
Figure 5. Carbonyl index of all slices.
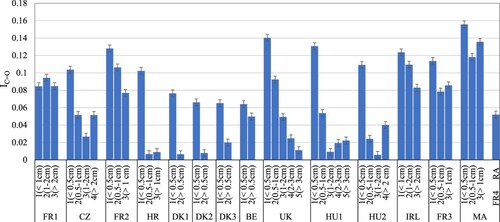
Figure 6. Butadiene and styrene indices for all slices.
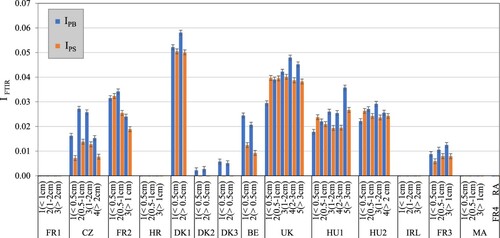
Figure 7. SARA fractions of top and bottom slice, only some sections are shown.
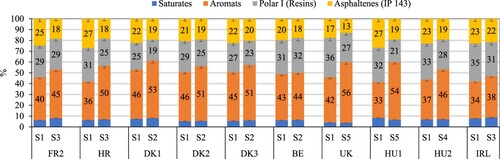
Figure 8. Relations between SARA fractions and carbonyl index.
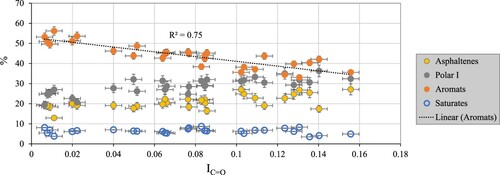
Figure 9. Black plots, left, and frequency sweeps at 50°C, right, of all slices derived from the HR and the HU2 section.
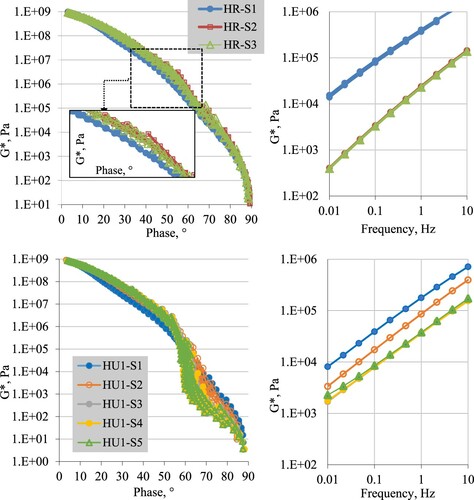
Figure 10. Calculated penetration at 25°C for all sections and all slices. The penetration of the original binder is added, if known.
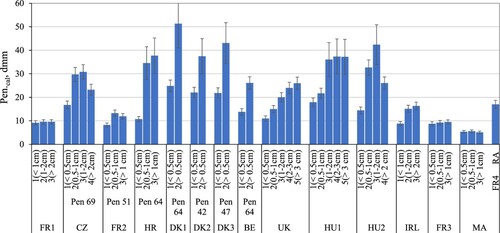
Figure 11. G-R for all sections and all slices.
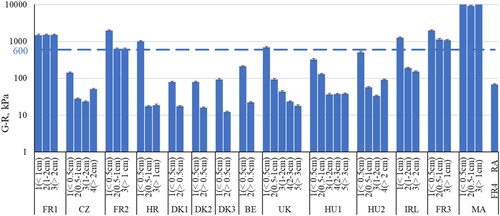
Figure 12. LSTDSR versus LmTDSR for selected pavement sites (vertical error bars are equal to the symbol size).
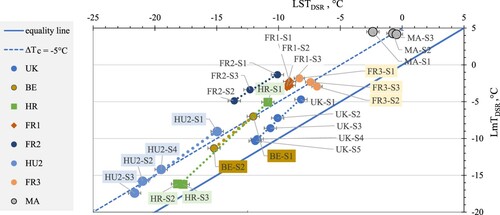
Table 5. Overview of a two-variable linear regression analysis: Pearson’s correlation coefficients (r) are plotted (only r values ≥0.8 and ≤−0.8 are shown).
Figure 13. Comparison of carbonyl indices of reference binders after RTFOT + PAV to field-aged top slices.
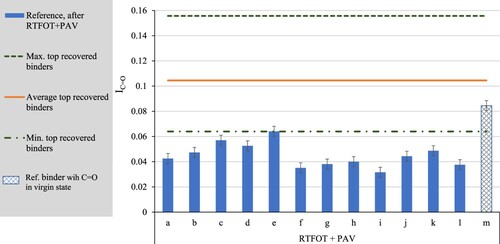
Figure 14. Phase angle versus G* at 0.005 rad/s and 15°C, representing top and bottom slices and reference binders, before and after laboratory ageing.
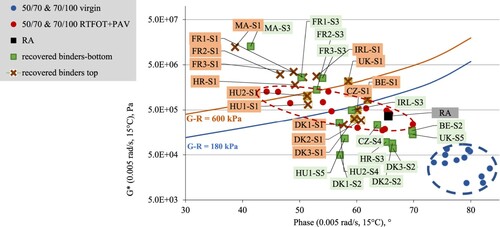
Figure 15. Phase angle versus G* at 0.005 rad/s and 15°C, including aged bottom slices.
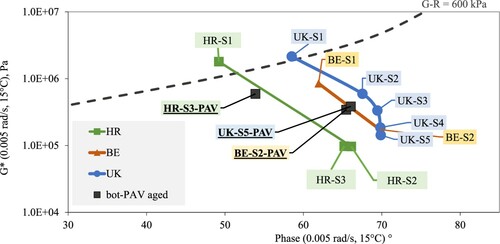
Figure 16. LSTDSR versus LmTDSR, including the aged bottom slices.
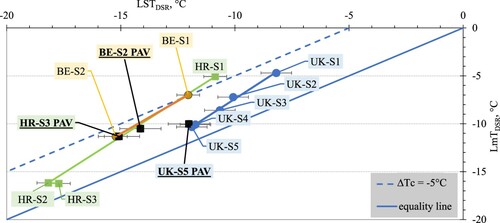
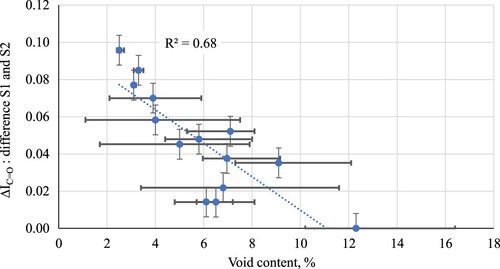
Figure 17. Difference in carbonyl index of top and second slice versus the void content of the surface layer. Error bars for the void content are equal to the variation in void contents of the individual cores. For ΔIC = O the absolute error on IC = O is doubled.