Figures & data
Figure 1. Picture of the test field constructed in 2012.
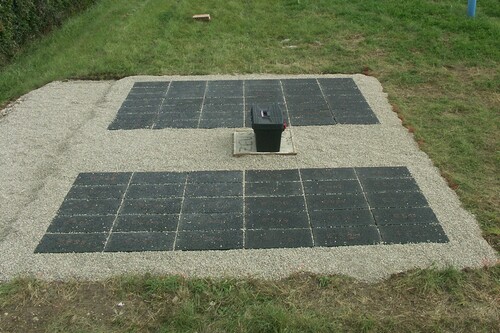
Table 1. Binder characteristics.
Figure 2. A schematic diagram (left) and Photo (right) of the initial setup.
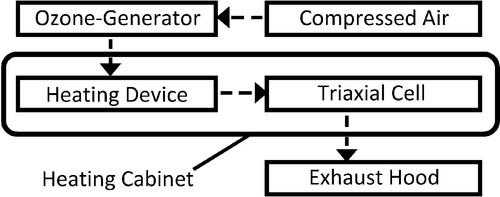
Figure 3. VAProcyl triaxial cell with three specimens (cut-out to show the inside).
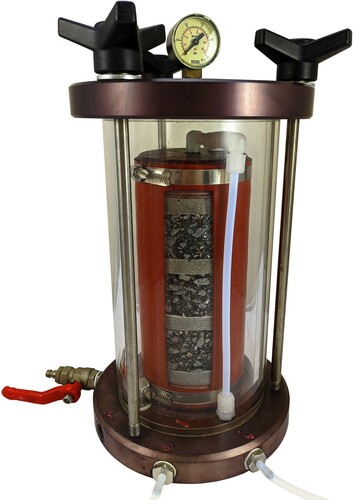
Figure 4. Inner part of the new heating device: photo (a) and CAD drawing (b).
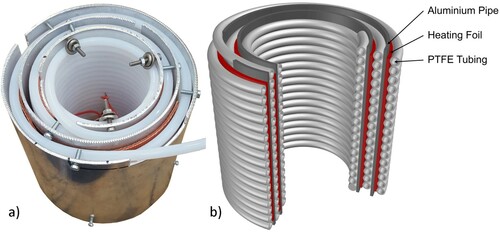
Figure 5. CIT-CY results: AC11 (binder A) – Increase in dynamic modulus |E*|.
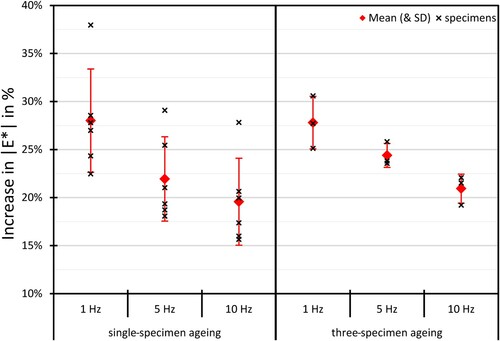
Figure 6. CIT-CY results: AC11 (binder A) – Decrease in phase angle φ.
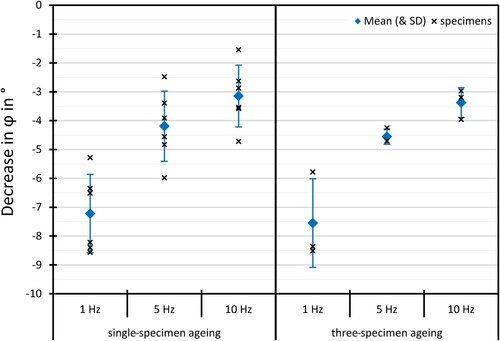
Table 2. CIT-CY tabular results: Mean values per frequency and corresponding standard deviation.
Figure 7. First CAD drawing of the new cell (a) and the final CAD version (b).
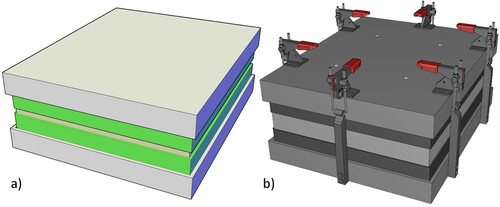
Figure 8. Photo of the new VAPropri prototype (a) and a photo without top cover (b).
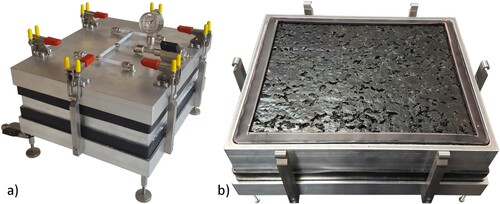
Figure 9. DSR results: SMA11 (binder A) – Comparison of dynamic shear modulus |G*| of the recovered and reference binders.
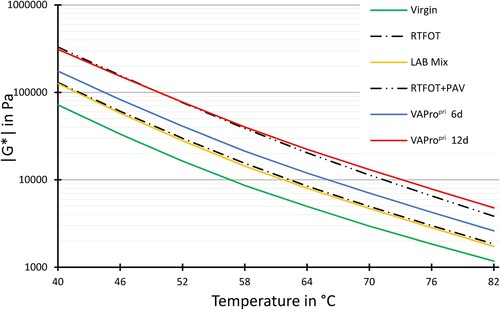
Figure 10. DSR results: SMA11 (binder A) – Comparison of phase angle δ of the recovered and reference binders.
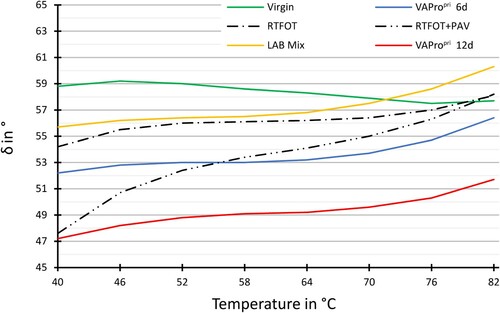
Figure 11. TSRST results: SMA11 (binder A) VAPropri.
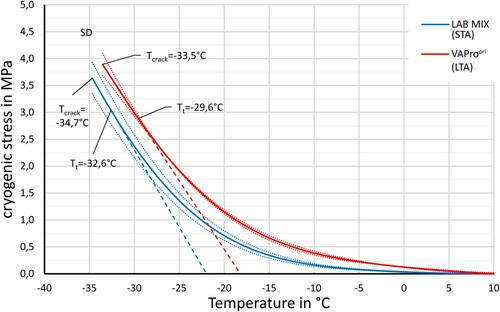
Figure 12. TSRST results: AC11 (binder A) test field A.
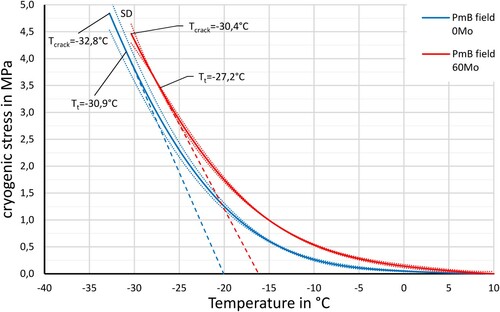
Figure 13. TSRST results: AC11 (binder B) test field B.
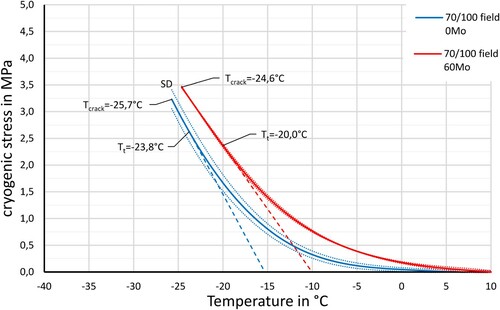
Table 3. Results of the TSRST analysis.
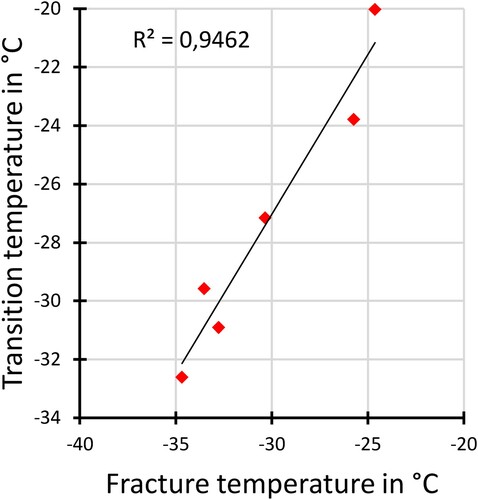
Figure 14. Relation between cracking temperature Tcrack and transition temperature Tt.