
Figures & data
Figure 1. Typical PD behaviour of UGMs in different SDR classes, depending on the stress level.
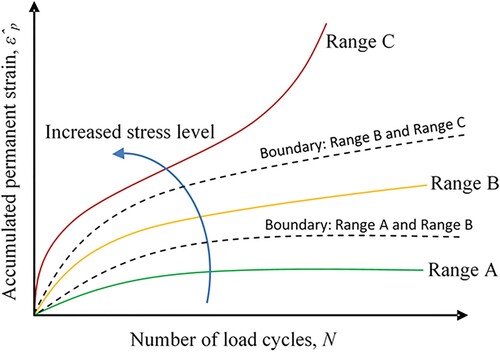
Table 1. Stress levels for MS RLT tests, prescribed by the European Standard (HSL).
Table 2. Stress levels for MS RLT tests, prescribed by the European Standard (LSL).
Figure 2. PSDs of the UGMs used for this study.
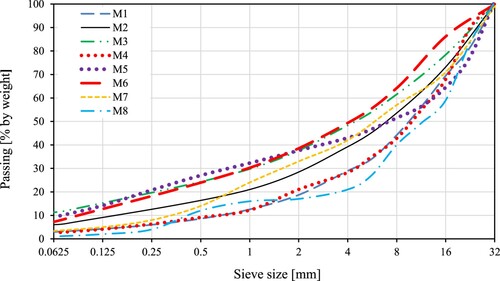
Table 3. Material properties.
Table 4. Test conditions.
Figure 3. Accumulation of permanent strain with the number of load cycles for M7 with w = 5.5% during MS RLT test with LSL.
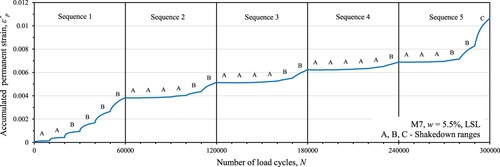
Figure 4. Typical model fitting and SDR matching.
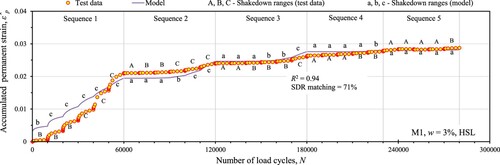
Figure 5. Measured and modelled accumulation of permanent strains for different w’s.
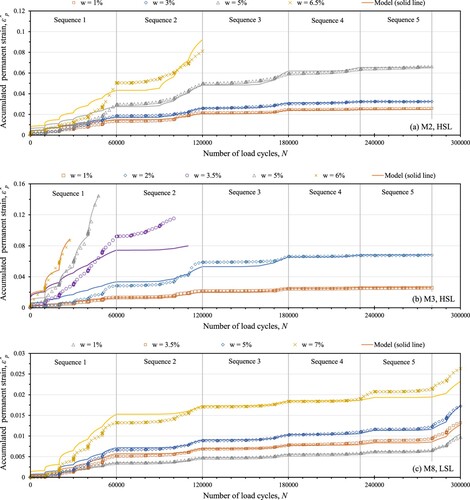
Table 5. Calibrated material parameters of the model.
Figure 6. Parameter a as a function of w for the different materials.
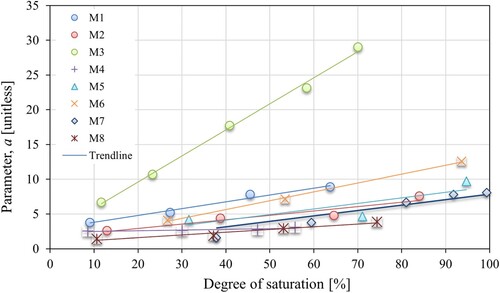
Table 6. Parameters of Equation (Equation9(9)
(9) ).
Figure 7. Measured versus predicted accumulation of permanent strain using the fitted models.
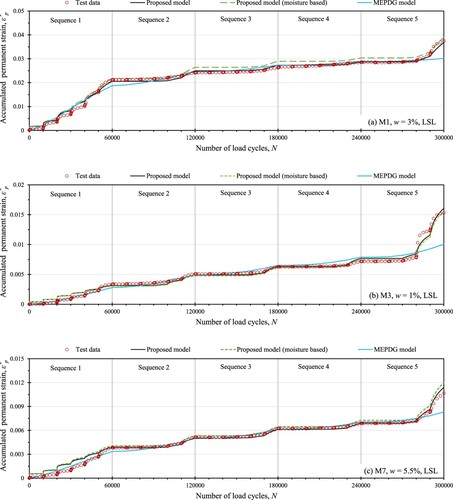
Table 7. Statistical evaluation of the quality of prediction by the models.
Figure 8. (a) Schematic of the test structure (Saevarsdottir & Erlingsson, Citation2014). (b) Measured vs. modelled PD in different layers.
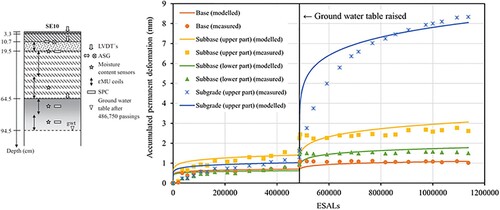
Table 8. Model parameters for the different layers of the pavement section.
Figure 9. Rut development in the two test structures: ERAPave PP predictions versus HVS test data.
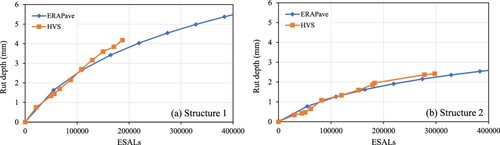
Table 9. Properties of the test structures.
Figure 10. PSDs of some additional materials tested.
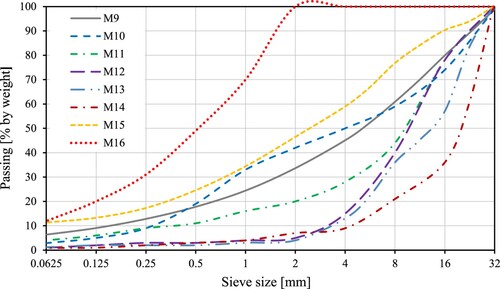
Table 10. Properties and test conditions of the additional materials.
Table 11. Model parameters determined for some additional materials.
Table 12. Suggested range of model parameters for UGMs with dmax = 31.5 mm, DOC: 95–97% (modified Proctor method).