Figures & data
Table 1. Mineral asphalt mix composition.
Figure 1. Prismatic specimen used in laboratory tests.
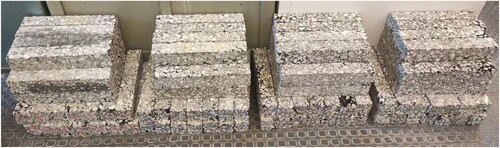
Table 2. General stiffness test conditions.
Figure 2. Hydraulic test machine.
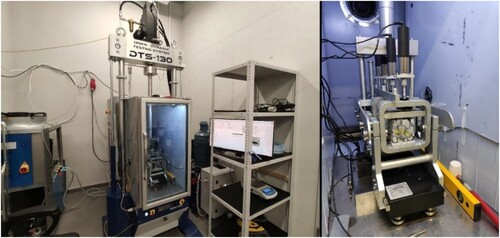
Figure 3. Test stand – freeze-thaw impact.
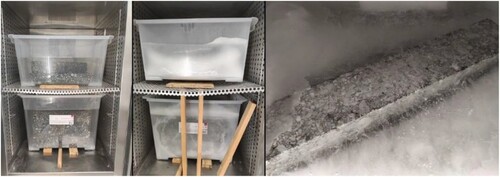
Figure 4. Experimental brine soaking pattern.
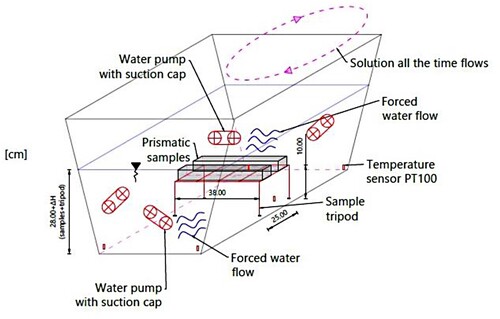
Figure 5. Armed container before road salt dosage.
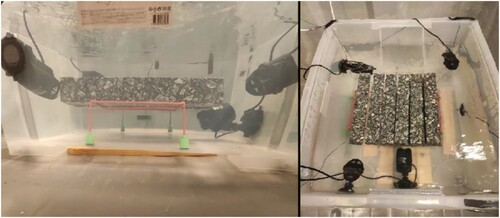
Figure 6. Road salt used in experiment and brine solution.
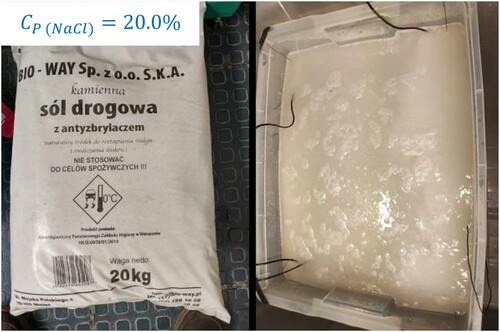
Figure 7. Sample result registered by testlab software.
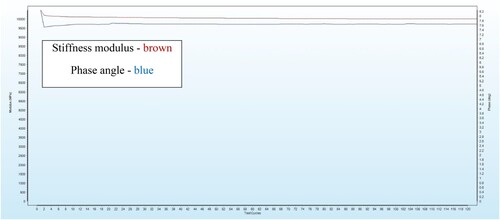
Table 3. Comprehensive test results.
Figure 8. Stiffness modulus fluctuation via different binder content levels.
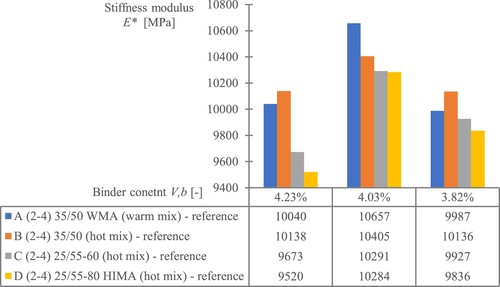
Figure 9. Water and frost impact on mix degradation: (a) Degradation versus binder content. (b) Degradation versus air void content.
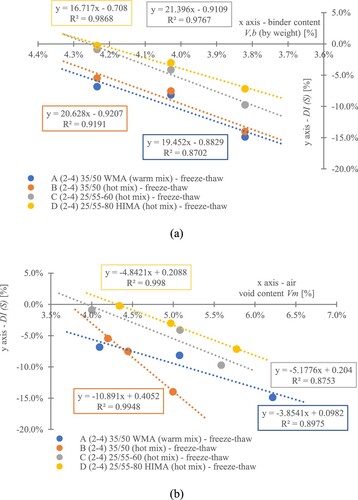
Figure 10. Correlation between ISTR and DI(S) – freeze-thaw (water and frost).
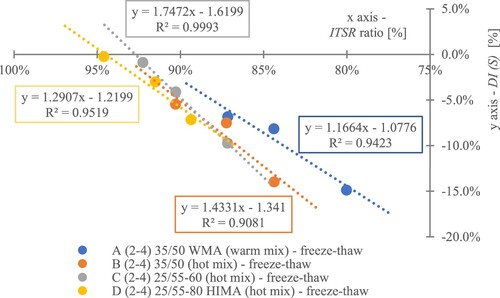
Figure 11. Road salt impact on mix degradation: (a) – degradation versus binder content, (b) – degradation versus air void content.
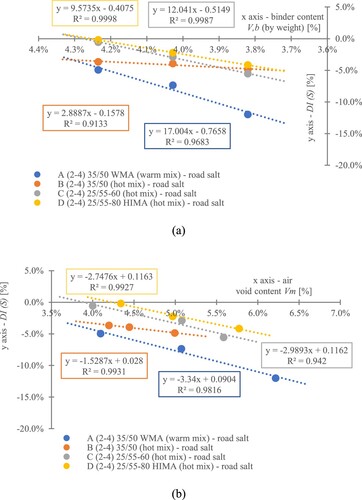
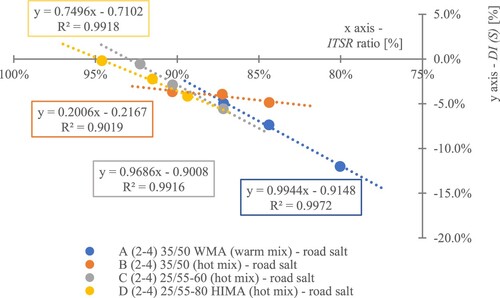
Figure 12. Correlation between ISTR and DI(S) – road salt.