
Figures & data
Figure 1. A typical SCANNER system.
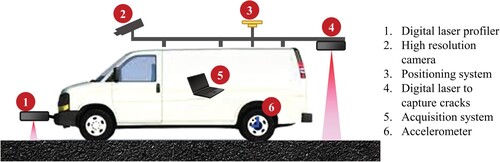
Figure 2. A map showing the study area and the road sections used in this study (The shown points represent the scanned road sections; bridges, roundabouts, and intersections were not included in the survey).
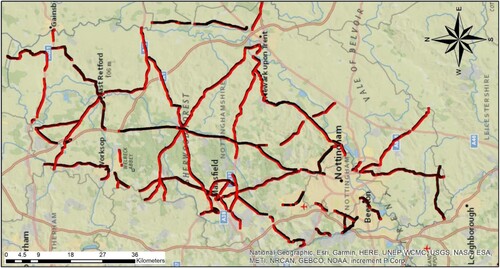
Table 1. Sample of the raw SCANNER data used in this study.
Table 2. Data pre-processing methods (Kargah-Ostadi et al., Citation2019).
Figure 3. Flow chart explaining the methodology of the study.
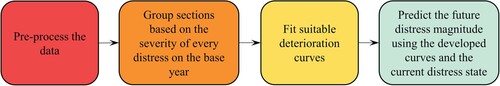
Figure 4. DDRs for rutting in the left wheel path.
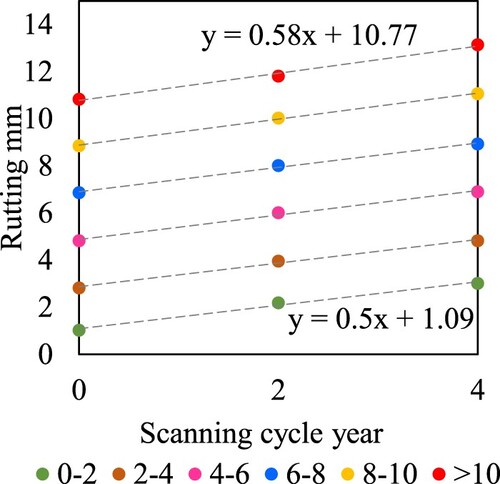
Figure 5. DDRs for rutting in the right wheel path.
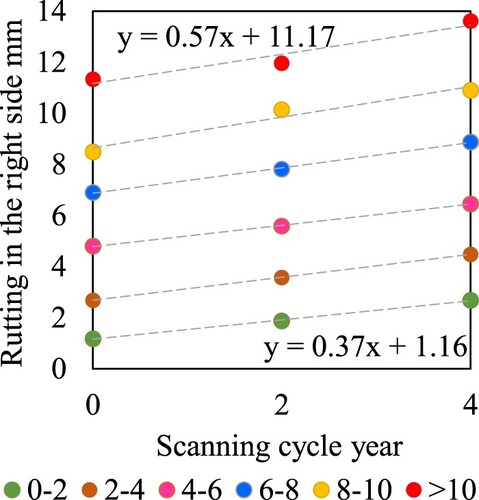
Figure 6. DDRs of the crack intensity over the whole carriageway.
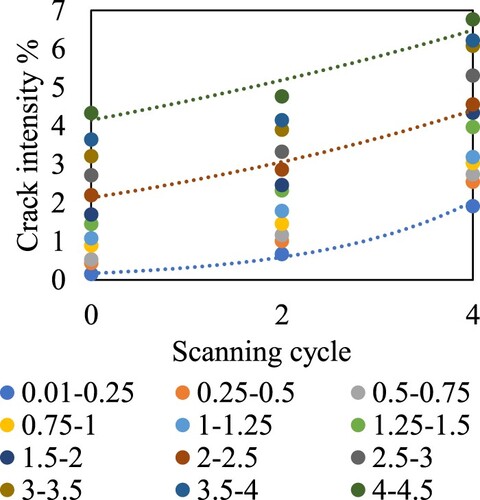
Figure 7. DDRs of the texture depth in the case of increasing texture over time.
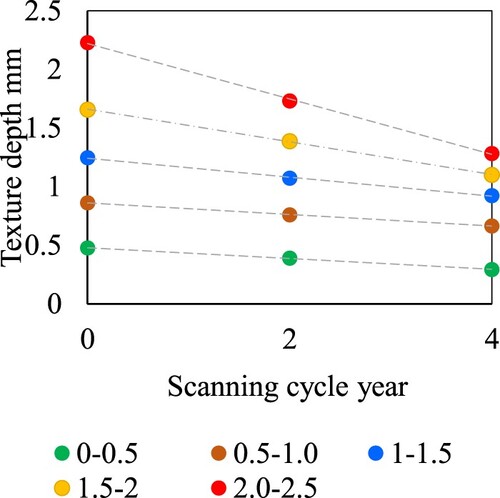
Table 3. Rutting data in the left and right wheel paths collected between 2014 and 2018.
Figure 8. Deterioration curve for rutting in the left wheel path.
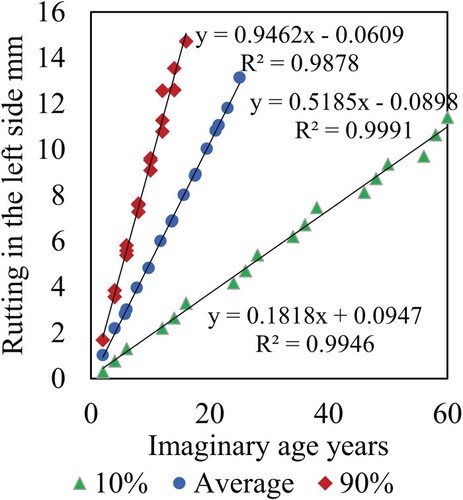
Figure 9. Deterioration curve for rutting in the right wheel path.
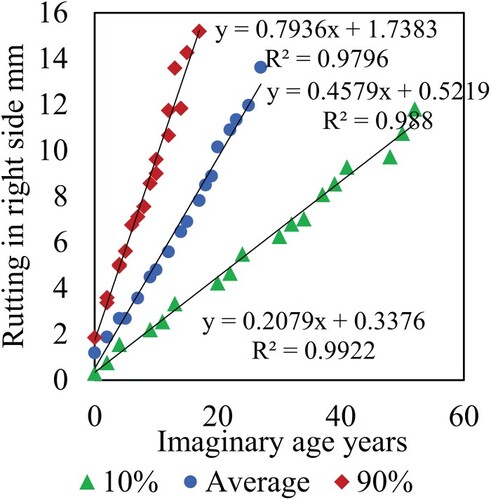
Figure 10. Deterioration curve for cracking over the whole carriageway.
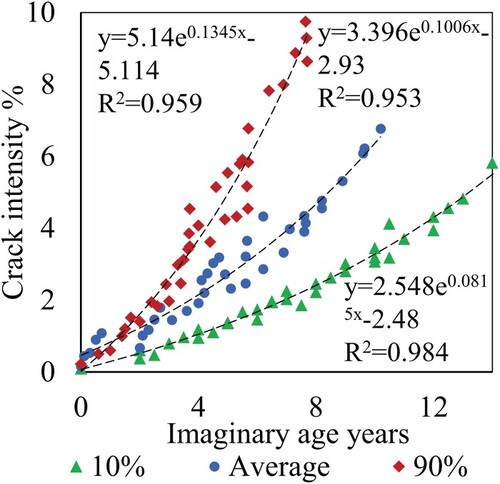
Figure 11. Deterioration curve for texture depth.
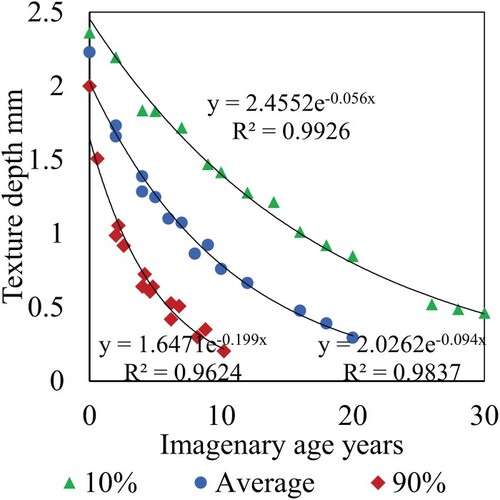
Table 4. Crack intensity and texture depth deterioration models at 10%, average, 90% reliability levels.
Figure 12. Distress predictions for year 2020 based on data collected in year 2018
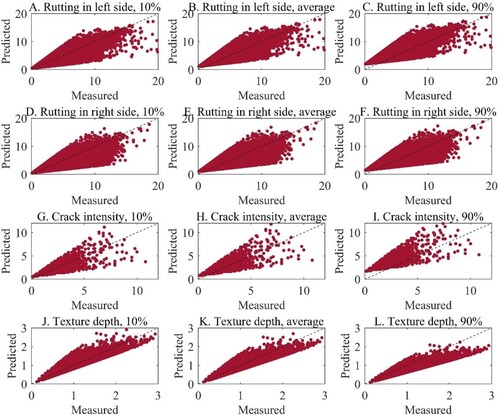
Table 5. Number of sections used in the validation process with, MSE, and R2 results.
Table 6. Criteria considered to rank the accuracy of the distress predictions.
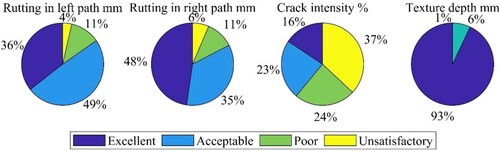
Figure 13. Pie chart illustrating the ranking of the predicted distress accuracy.
Data availability
The data underlying this article will be made available upon reasonable request from the corresponding author subject to data owner approval.