Figures & data
Table 1. Specifications of Q 70/100 and T 70/100 binders at fresh (unaged) state.
Figure 1. (a) Bitumen film of 1 mm in a petri-dish, (b) Climate chamber setup.
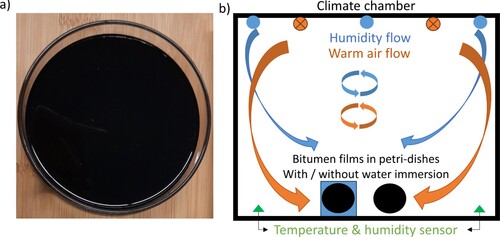
Figure 2. Average (a) minimum and maximum temperature, (b) precipitation (mm), (c) relative humidity (%) in Amsterdam, Netherlands during Jan. 2021 to Dec. 2021, from weather-and-climate.com.
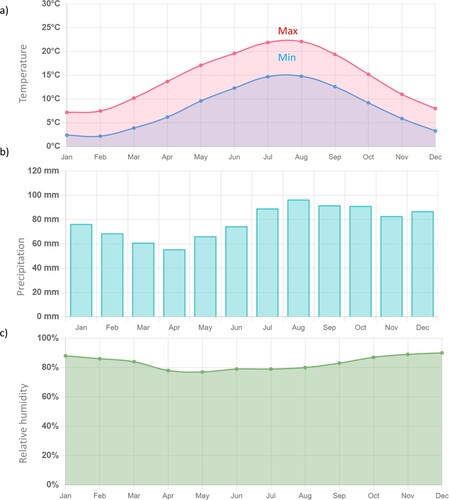
Table 2. Main functional groups of binder in FTIR spectra (Zhang et al., Citation2019).
Figure 3. Illustration of a dendrogram depicting the hierarchy of leaves and clades.
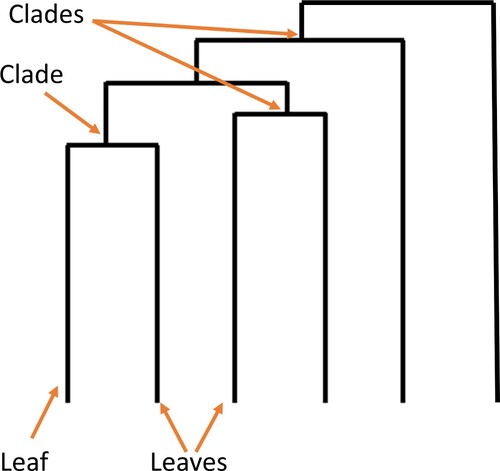
Figure 4. FTIR spectra of Q binder aged at 60°C with 95% humidity during different aging times, i.e. 1, 7, 14, and 21 days.
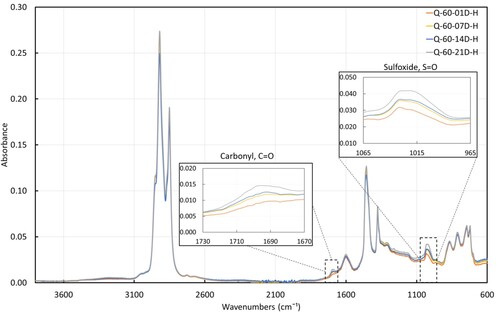
Figure 5. FTIR results for (a) carbonyl index of Q samples, (b) carbonyl index of T samples, (c) sulfoxide index of Q samples, (d) sulfoxide index of T samples aged at 60°C, 70°C, and 85°C for 1, 7, 14, and 21 days in thermo-oxidative (O), hygrothermal (H), and water-immersion (W) conditions.
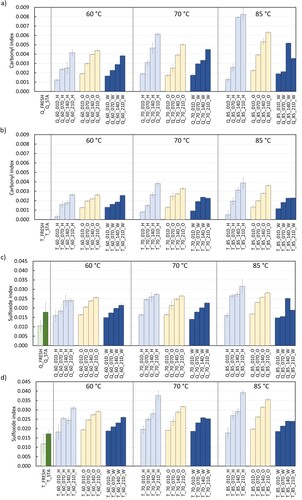
Figure 6. FTIR results for field aged samples of 2014–2018, (a) carbonyl index, (b) sulfoxide index.
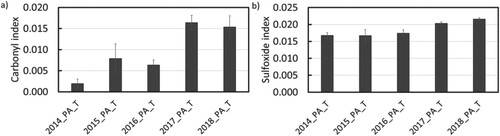
Figure 7. Master curves (at 20°C) at 60°C for (a) Q binder and (b) T binder, at all aging states, i.e. fresh, TFOT short-term aged, and 1, 7, 14, 21 days (D) of hygrothermal (H), aqueous-thermal (W), and thermo-oxidative (O) conditioning.
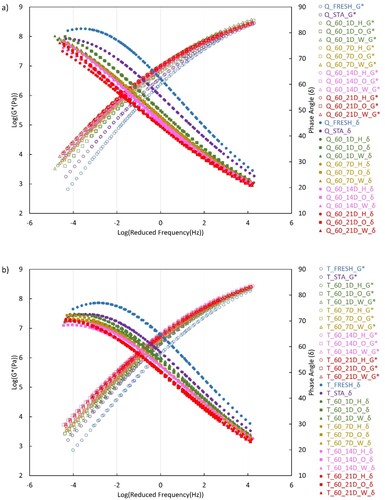
Figure 8. Master curves (at 20°C) at 70°C for (a) Q binder and (b) T binder, at all aging states, i.e. fresh, TFOT short-term aged, and 1, 7, 14, 21 days (D) of hygrothermal (H), aqueous-thermal (W), and thermo-oxidative (O) conditioning.
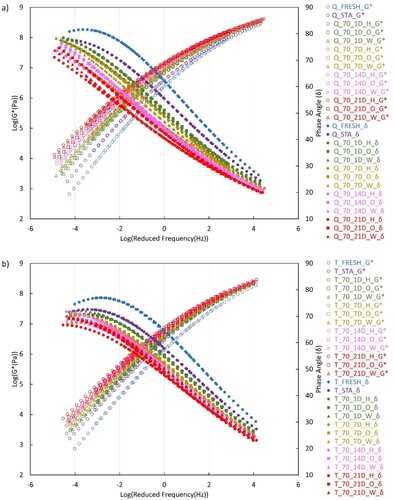
Figure 9. Master curves (at 20°C) at 85°C for (a) Q binder and (b) T binder, at all aging states, i.e. fresh, TFOT short-term aged, and 1, 7, 14, 21 days (D) of hygrothermal (H), aqueous-thermal (W), and thermo-oxidative (O) conditioning.
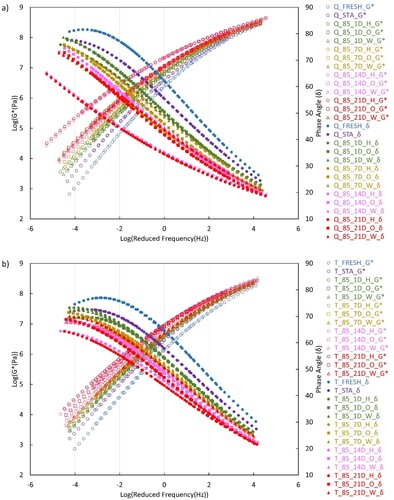
Figure 10. Master curves (at 20°C) of field aged samples from 2014 to 2018.
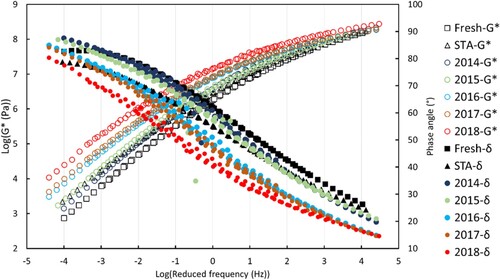
Figure 11. Crossover complex modulus versus crossover frequency of Q binder at (a) 60°C, (b) 70°C, and (c) 85°C at all aging states, i.e. fresh, TFOT short-term aged, and 1, 7, 14, 21 days (D) of hygrothermal (H), aqueous-thermal (W), and thermo-oxidative (O) conditioning, (d) all 21-day aged samples of all conditions.
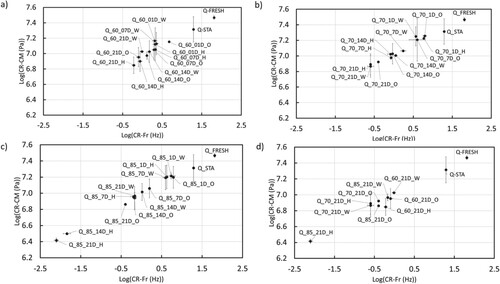
Figure 12. Crossover complex modulus versus crossover frequency of T binder at (a) 60°C, (b) 70°C, and (c) 85°C at all aging states, i.e. fresh, TFOT short-term aged, and 1, 7, 14, 21 days (D) of hygrothermal (H), aqueous-thermal (W), and thermo-oxidative (O) conditioning, d) all 21-day aged samples of all conditions.
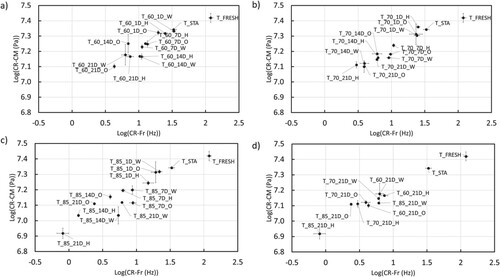
Figure 13. Crossover complex modulus versus crossover frequency of field aged samples of 2014–2018.
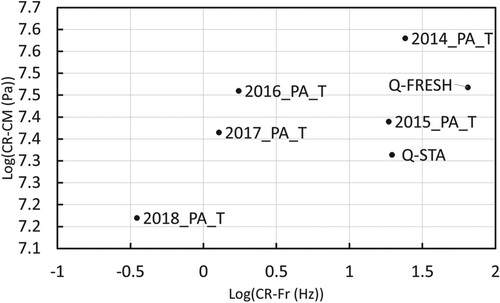
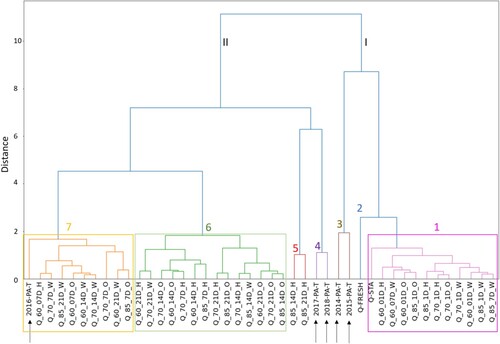
Figure 14. Hierarchical clustering analysis of all laboratory-aged samples in combination with field aged samples from 2014 to 2018.