
Figures & data
Figure 1. Fairclough’s ‘social’ model of texts.
Figure 2. Number of state-level Bills restricting rights of LGBTIQ+ people attempted, by year (2018–2022).
Figure 3. Number of state-level bills restricting rights of LGBTIQ+ people attempted, by state (2018–2022).
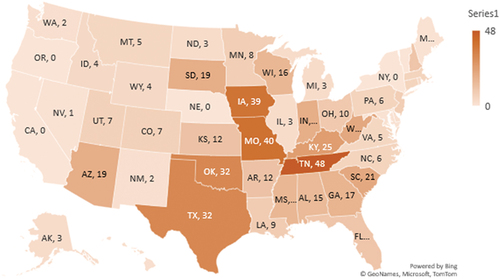
Figure 4. Foci of state-level bills restricting rights of LGBTIQ+ people attempted (n = 543).
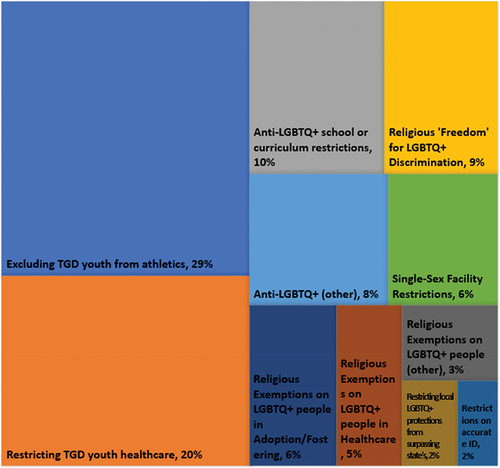
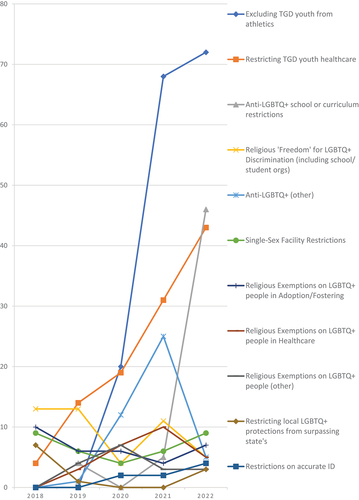
Figure 5. Focus of Bills attempted, by year (n = 543).
Supplemental material
Supplemental Material
Download MS Word (72.3 KB)Data availability statement
Contained in an online supplemental table and by application ([email protected]) https://doi.org/10.25949/23814150.