
Figures & data
Table 1. Participant demographic information and descriptive statistics.
Table 2. Correlation matrix of study factors.
Table 3. Associations between sexual satisfaction and quality of life across and between genders.
Figure 1. Gender X Intrapersonal SS interaction predicting depression.
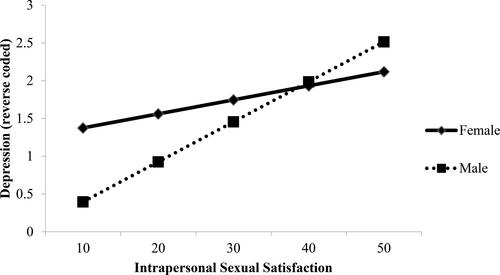
Figure 2. Gender X Intrapersonal SS interaction predicting anxiety.
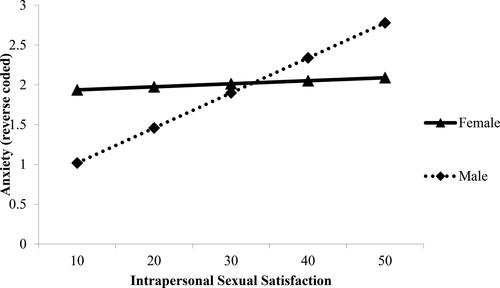
Figure 3. Gender X Intrapersonal SS interaction predicting relational satisfaction.
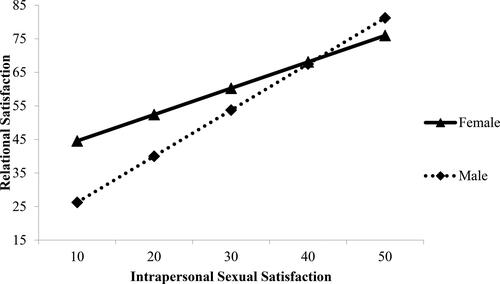
Figure 4. Gender X Interpersonal SS interaction predicting life satisfaction.
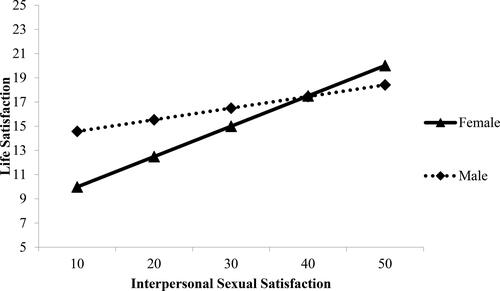
Table 4. Interaction models testing gender differences in the association between SS and QOL.
