Figures & data
Figure 1. 3D printing machine using the new mini-deposition system.
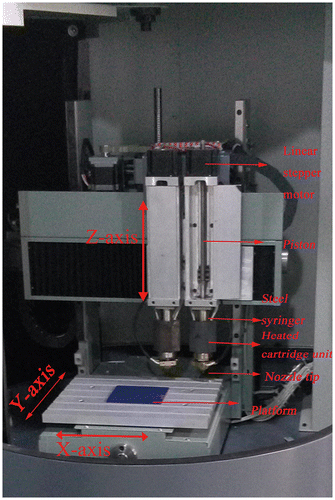
Figure 2. (A) Optical and (B) SEM images for three scaffolds: 3D printed PLA/HA (1), β-TCP (2) and DBM (3).
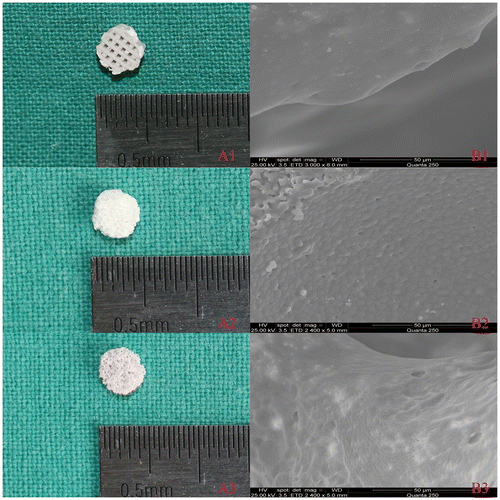
Table 1. Scaffold properties.
Figure 3. BMSC responses to three scaffolds. (A) SEM images of the attachment of BMSCs on (1) PLA/HA, (2) β-TCP and (3) DBM scaffolds after culturing for seven days. (B, C) The fluorescence images of proliferation of BMSCs on (1) PLA/HA, (2) β-TCP and (3) DBM scaffolds after culturing for seven days. (← The state of proliferation of BMSCs; ▄ the selected areas in B corresponding to C. Length scales: (A) 50 μm, (B) 10 μm and (C) 8 μm).
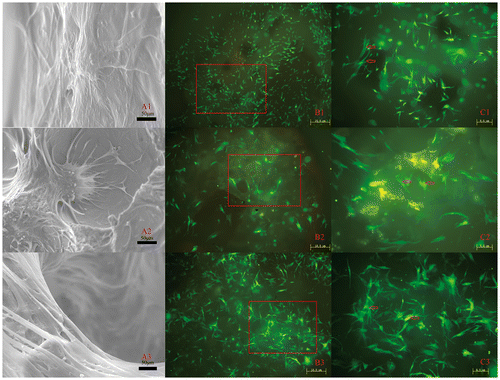
Figure 4. Quantitative analysis of three scaffolds: (A) cell adhesion rate, (B) cell proliferation, (C) ALP activity, (D) osteogenic gene expression and (E) COL-1 of BMSCs cultured on different scaffolds (*p<0.05).
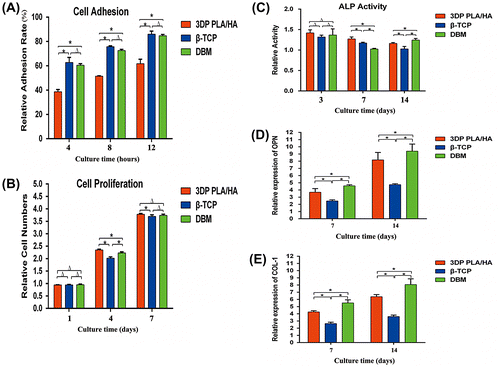
Figure 5. Micro CT images for three scaffolds. (A) Plane and profile images of (1) PLA/HA, (2) β-TCP and (3) DBM scaffolds before implanting. (B) Typical micro-CT images of (1) PLA/HA, (2) β-TCP and (3) DBM scaffolds as well as (4) bone defect without scaffold at four weeks in vivo. (C) Micro-CT images of (1) PLA/HA, (2) β-TCP and (3) DBM scaffolds as well as (4) bone defect without scaffold at eight weeks in vivo.
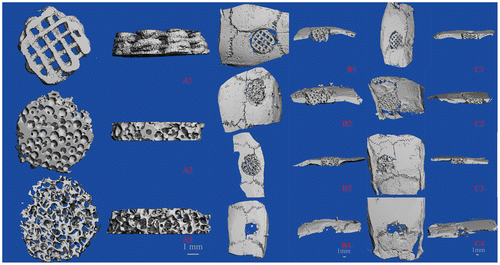
Table 2. Hematological variables in blood from rats at different times after surgery.
Figure 6. BV/TV and degradation rate in every group (A) Percentage of new bone formation at four and eight weeks. (B) Percentage of degradation of three scaffolds at four and eight weeks. (*p<0.05)
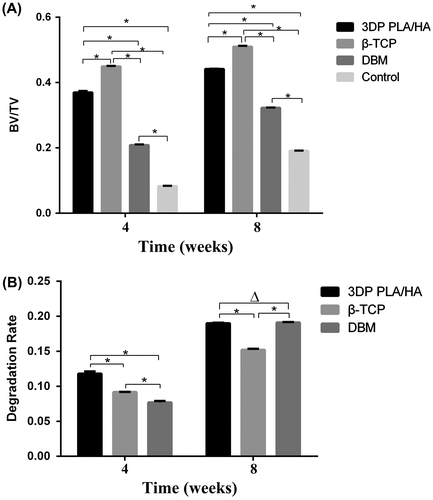
Figure 7. HE images of implanted and control group after four and eight weeks. (A) Histological images of implanted (1) PLA/HA, (2) β-TCP and (3) DBM scaffolds as well as (4) control group four weeks after implantation. (B) Histological images of (1) implanted PLA/HA, (2) β-TCP and (3) DBM scaffolds as well as (4) control group eight weeks after implantation. Scale bars 10 μm.
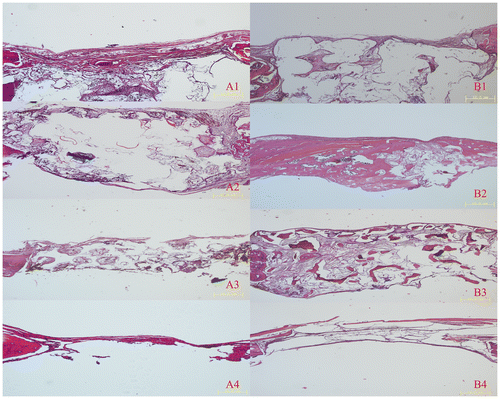
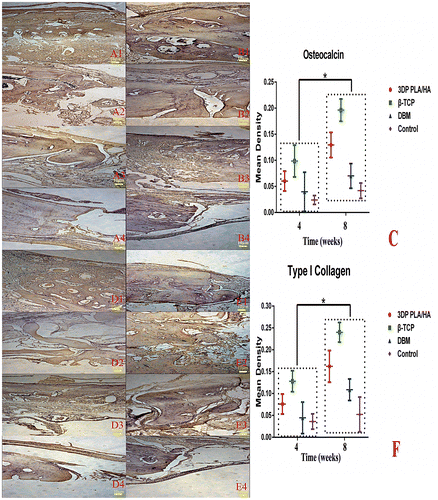
Figure 8. Immunohistochemical examination of osteocalcin and type I collagen were carried out in the margin of bone defect in different time (magnification ×100). (A) Osteocalcin expression images of implanted (1) PLA/HA, (2) β-TCP and (3) DBM scaffolds as well as (4) control group four weeks after implanting. (B) Osteocalcin expression images of implanted (1) PLA/HA, (2) β-TCP and (3) DBM scaffolds as well as (4) control group eight weeks after implanting. (C) Semi-quantitative scatter plot of osteocalcin expression. (D) Type I collagen expression images of implanted (1) PLA/HA, (2) β-TCP and (3) DBM scaffolds as well as (4) control group four weeks after implanting. (E) Type I collagen expression images of implanted (1) PLA/HA, (2) β-TCP and (3) DBM scaffolds as well as (4) control group eight weeks after implanting. (F) Semi-quantitative scatter plot of type I collagen expression (*p<0.05).