Figures & data
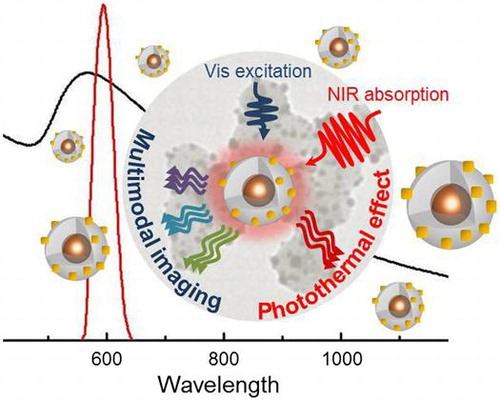
Figure 1. TEM images (A–C), UV-vis absorbance (D) and photoluminescence spectra (E) of QD@SiO2 prepared at a QD concentration of 10−6 M in cyclohexane, IGEPAL CO520 (350 μl), NH4OH (200 μl), by adding 20 μl (A, E blue line), 30 μl (B, E green line) and 50 μl (C, D, E red line) of TEOS. PL spectrum of bare QDs in chloroform (E, dashed line).
Figure 2. Time-resolved fluorescence intensity decays (A) and average lifetime (B) of QD (black line, QD@SiO2 (red trace) and QDn@SiO2 (blue trace).
Figure 3. TEM micrographs of amino-functionalized QD@SiO2 before (A), and after (B) assembly of Au seeds, and (C–E) further Au deposition; each frame shows the nanoshell at different concentrations of Au precursor solutions: 0.5 M (C), 2 M (D) and 4 M (E) The UV-vis-NIR absorbance spectra of samples C–E are reported in panel F (each suspension has been diluted 1:5 in order to reduce scattering contribution to the absorption). Emission spectra of sample in Figure (E) (λex=400 nm).
Figure 4. Summary of the spectral features of the obtained Au speckled QDs, which make the multifunctional architectures ideal candidate for theranostic application.
Figure 5. General scheme for the QD functionalization process leading to SiO2 shell growth (step 1), functionalization with amine groups upon reaction with (3-aminopropyl)triethoxysilane (step 2) and subsequent assembly of Au seeds and progressive formation of Au NPs upon the addition of K2CO3 and HAuCl4 (steps 3, 4, 5).