Figures & data
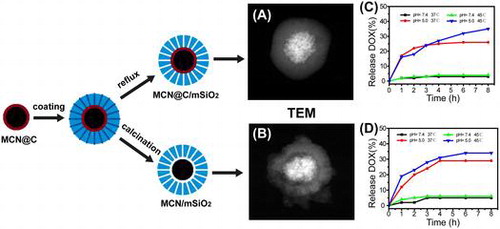
Figure 1. The wide-angle XRD patterns (A) and magnetization curves measured at room temperature (B) of the MCN@C, MCN@C/mSiO2 and MCN/mSiO2 nanoparticles.
Figure 2. SEM and STEM images of the MCN@C (A, D); MCN@C/mSiO2 (B, E); and MCN/mSiO2 (C, F) nanoparticles.
Figure 3. N2 adsorption-desorption isotherms (A) of the MCN@C, MCN@C/mSiO2 and MCN/mSiO2 nanoparticles and their corresponding pore size distribution curves (B).
Table 1. The structure parameters, DOX loading capacities and SAR values of the MCN@C, MCN@C/mSiO2 and MCN/mSiO2 nanoparticles.
Figure 4. The magnetic heating curves of the MCN@C, MCN@C/mSiO2 and MCN/mSiO2 nanoparticles with a concentration of 30 mg ml–1 in H2O evaluated under an alternating magnetic field. The magnetic field strength and frequency are 180 Gauss and 409 kHz, respectively.
Figure 5. The DOX release behaviors from the MCN@C/mSiO2 (A) and MCN/mSiO2 (B) nanoparticles in the release media of pH 7.4 and 5.0 and at temperatures of 37 and 45°C.

Figure 6. Viabilities of the MCN@C, MCN@C/mSiO2 and MCN/mSiO2 nanoparticles to HeLa cells after incubation for 24 h evaluated using CCK-8 assay.
Figure 7. Cellular uptake of the MCN@C, MCN@C/mSiO2 and MCN/mSiO2 nanoparticles in HeLa cells after 4 h of incubation with a concentration of 100 μg ml–1: DIC shows the optical photograph of HeLa cells; Nucleus shows the nuclei of HeLa cells stained with Hoechst 33342; RBITC shows the location of RBITC-labeled nanoparticles; Merged shows the overlap DIC, Nucleus and RBITC images, indicating that RBITC-labeled MCN@C, MCN@C/mSiO2 and MCN/mSiO2 nanoparticles were taken up by HeLa cells. All scale bars are 25 μm.