Figures & data
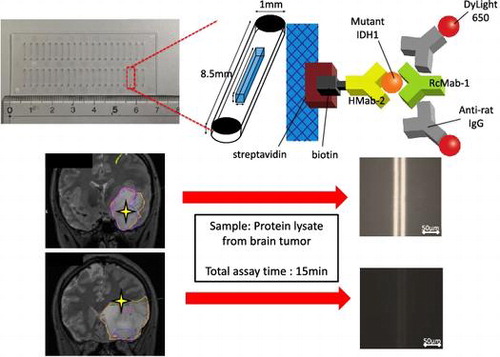
Figure 1. Schematic representation of the immuno-wall device. (A) Immuno-wall chips with 40 microchannels (each 1 mm in width, 40 μm in height and 8.5 mm in length) in a cyclic olefin polymer substrate were constructed using photolithography. (B) The channels were filled with 6% azide-unit pendant water-soluble photopolymer (AWP) and 10 mg ml–1 streptavidin. UV light (313 nm, 20 mW cm–2) through slits in a photomask was used to immobilize the photoreactive polymer in the center of the channels, before the uncured polymer was washed with PBS. (C, D) A biotinylated anti-R132H-IDH1 antibody (HMab-2), an anti-wild-type IDH1 antibody (RcMab-1), and a fluorescent DyLight650-conjugated goat anti-rat IgG antibody were used to label IDH1-R132H. Note that RcMab-1 is interacted with multiple numbers of DyLight 650-conjugated anti-rat IgGs.
Figure 2. Sensitivity and specificity of the immuno-wall assays. (A) Western blotting confirmed that the anti-IDH1-R132H antibody, HMab-2, was specific to the lysate from NHA-IDH1-R132H and U87-IDH1-R132H cells, whereas the anti-IDH1 antibody, RcMab-1, recognized both wild-type IDH1 and IDH1-R132H in NHA and U87 cells. (B) U87 and NHA cells expressing wild-type IDH1 did not show fluorescence, while both types of cells expressing IDH1-R132H displayed strong fluorescence.
Figure 3. Effect of mutated IDH1/wild-type IDH1 ratio on the detection of mutated IDH1. When mutated IDH1 comprised more than 10% of the cell lysate, strong fluorescence was observed. However, when the proportion of mutated cells was below 5%, fluorescence was difficult to distinguish from the background.
Table 1. Patient characteristics and summarized results.
Figure 4. Effect of the mutant allele frequency in clinical samples on the detection of mutated IDH1. The lysate from a tumor sample with a mutant allele frequency of 40% was mixed with the lysate from a tumor sample with wild-type IDH1 such that the mutant allele frequency decreased stepwise from 40% to 20, 10, 5, 2, and 1%. The immuno-wall assay IDH1-R132H detected the mutant allele frequency in samples containing as low as 10% mutant IDH1.
Figure 5. Tumor boundary detected using the immuno-wall assay. During tumor removal surgery in a patient, two specimens were collected. (A1, A2) A specimen from the center of the tumor tested positive in the immuno-wall assay. (B1, B2) In contrast, a specimen from the margins of the tumor, which appeared normal, tested negative. (A3, A4, B3, B4) The IDH1 status of these samples was confirmed using immunohistochemistry and DNA sequencing.