2,702
Views
49
CrossRef citations to date
0
Altmetric
Organic and soft materials (colloids, liquid crystals, gel, polymers)

Recyclable nanoscale zero-valent iron-based magnetic polydopamine coated nanomaterials for the adsorption and removal of phenanthrene and anthracene

, , &
Pages 3-16 | Received 26 May 2016, Accepted 07 Oct 2016, Published online: 06 Jan 2017

Figures & data

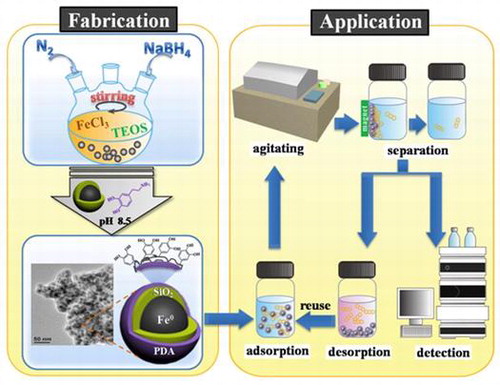
Table 1. Selected properties of phenanthrene and anthracene.

Figure 1. Schematic illustration of the synthesis of Fe@SiO2@PDA nanocomposites.

Figure 1. Schematic illustration of the synthesis of Fe@SiO2@PDA nanocomposites.

Figure 2. TEM images of (a) Fe@SiO2, (b) Fe@SiO2@PDA; size distribution histograms of (c) Fe@SiO2 and (d) Fe@SiO2@PDA; and corresponding EDS spectra of (e) Fe@SiO2 and (f) Fe@SiO2@PDA.

Figure 2. TEM images of (a) Fe@SiO2, (b) Fe@SiO2@PDA; size distribution histograms of (c) Fe@SiO2 and (d) Fe@SiO2@PDA; and corresponding EDS spectra of (e) Fe@SiO2 and (f) Fe@SiO2@PDA.

Figure 3. XRD pattern of Fe@SiO2 (a); overview (b) and high-resolution XPS spectra for Fe (c) and C (d). FTIR (e) and VSM hysteresis curves (f) of Fe@SiO2 and Fe@SiO2@PDA nanocomposites.

Figure 3. XRD pattern of Fe@SiO2 (a); overview (b) and high-resolution XPS spectra for Fe (c) and C (d). FTIR (e) and VSM hysteresis curves (f) of Fe@SiO2 and Fe@SiO2@PDA nanocomposites.

Table 2. Comparison of several iron-based nanoparticles.

Figure 4. Influence of pH (a), ionic strength (b), HA concentration (c) and initial concentration (d) on the removal of PHE and ANT by the as-prepared Fe@SiO2@PDA.

Figure 4. Influence of pH (a), ionic strength (b), HA concentration (c) and initial concentration (d) on the removal of PHE and ANT by the as-prepared Fe@SiO2@PDA.

Figure 5. Kinetics of PHE and ANT removal by Fe@SiO2@PDA nanocomposites (a) and the fitted curves of pseudo-first-order model (b), pseudo-second-order model (c) and intraparticle diffusion model (d).

Figure 5. Kinetics of PHE and ANT removal by Fe@SiO2@PDA nanocomposites (a) and the fitted curves of pseudo-first-order model (b), pseudo-second-order model (c) and intraparticle diffusion model (d).

Table 3. Adsorption rate constants for kinetic models at 298 K pH 7.0.

Figure 6. Adsorption isotherms of PHE (a), ANT (b) at 298, 303 and 308 K.

Figure 6. Adsorption isotherms of PHE (a), ANT (b) at 298, 303 and 308 K.

Table 4. Regression parameters of isotherm models.

Figure 7. Adsorption isotherms of ANT fitting by two stages at 298 K, (a) Langmuir, (b) Freundlich, (c) Temkin, (d) D–R model.

Figure 7. Adsorption isotherms of ANT fitting by two stages at 298 K, (a) Langmuir, (b) Freundlich, (c) Temkin, (d) D–R model.

Table 5. Thermodynamic parameters of PHE and ANT.

Figure 8. Recyclable adsorption of ANT by Fe@SiO2@PDA.

Figure 8. Recyclable adsorption of ANT by Fe@SiO2@PDA.