1,950
Views
21
CrossRef citations to date
0
Altmetric
Bio-inspired and biomedical materials

Micromorphological effect of calcium phosphate coating on compatibility of magnesium alloy with osteoblast

&
Pages 96-109 | Received 31 Aug 2016, Accepted 25 Nov 2016, Published online: 23 Jan 2017

Figures & data

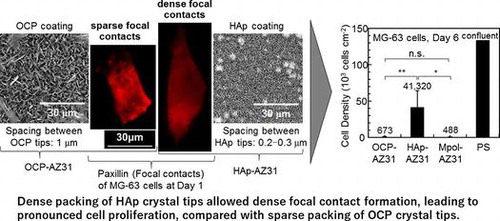
Table 1. Composition of AZ31 extruded rod (wt%).

Figure 1. Experimental procedure for (a) fluorescence microscopy (b) cell viability assay, and (c) immunostaining of focal contacts.

Figure 1. Experimental procedure for (a) fluorescence microscopy (b) cell viability assay, and (c) immunostaining of focal contacts.

Figure 2. XRD patterns of OCP- and HAp-coated AZ31 alloy disks formed at (a) pH 6.1 and (b) pH 8.9, respectively. High relative intensities of (002) and (004) peaks indicates the preferential orientation of (002) planes of OCP and HAp crystals parallel to the substrate surface.

Figure 2. XRD patterns of OCP- and HAp-coated AZ31 alloy disks formed at (a) pH 6.1 and (b) pH 8.9, respectively. High relative intensities of (002) and (004) peaks indicates the preferential orientation of (002) planes of OCP and HAp crystals parallel to the substrate surface.

Figure 3. (a, b) Surface and (c, d) cross sectional SEM images of (a, c) OCP- and (b, d) HAp-AZ31. For cross-sectional observation, OCP and HAp coating layers were scraped off the surface of the substrate.

Figure 3. (a, b) Surface and (c, d) cross sectional SEM images of (a, c) OCP- and (b, d) HAp-AZ31. For cross-sectional observation, OCP and HAp coating layers were scraped off the surface of the substrate.

Figure 4. Fluorescence images of MG-63 cells on the entire surface of (a, c) OCP- and (b, d) HAp-AZ31, cultured for (a, b) two days and (c, d) six days. Optical images of (e) OCP- and (f) HAp-AZ31 disks after culturing cells for six days. (a-1–d-1) composite images of calcein-, PI-, and Hoechst33342-stained cell images (living cells, green; dead cells, red; nuclei of both cells, blue), and (a-2–d-2) PI-stained images converted to monochrome image (dead cells, black).

Figure 4. Fluorescence images of MG-63 cells on the entire surface of (a, c) OCP- and (b, d) HAp-AZ31, cultured for (a, b) two days and (c, d) six days. Optical images of (e) OCP- and (f) HAp-AZ31 disks after culturing cells for six days. (a-1–d-1) composite images of calcein-, PI-, and Hoechst33342-stained cell images (living cells, green; dead cells, red; nuclei of both cells, blue), and (a-2–d-2) PI-stained images converted to monochrome image (dead cells, black).

Figure 5. (a) Composite image of calcein-, PI-, and Hoechst33342-stained cell images (living cells, green; dead cells, red; nuclei of both cells, blue) and (b) optical images of the entire surface of HAp-AZ31 at day 6 and (c) SEM image of dead cell regions (i) on image (a). Dead-cell regions are encircled with dotted lines on images (a) and (b).

Figure 5. (a) Composite image of calcein-, PI-, and Hoechst33342-stained cell images (living cells, green; dead cells, red; nuclei of both cells, blue) and (b) optical images of the entire surface of HAp-AZ31 at day 6 and (c) SEM image of dead cell regions (i) on image (a). Dead-cell regions are encircled with dotted lines on images (a) and (b).

Figure 6. (a, b) Cell densities on OCP-, HAp- and Mpol-AZ31 and polystyrene (PS) dish at days 1 and 6. (c, d) Magnesium ion concentration of medium at days 1 and 6 used for cell culture on OCP-, HAp- and Mpol-AZ31 and PS. Dashed lines in (c) and (d) correspond to the original Mg2+ ion concentration of the medium. Cell density as a function of Mg2+ ion concentration in the medium at (e) day 1 and (f) day 6.

Figure 6. (a, b) Cell densities on OCP-, HAp- and Mpol-AZ31 and polystyrene (PS) dish at days 1 and 6. (c, d) Magnesium ion concentration of medium at days 1 and 6 used for cell culture on OCP-, HAp- and Mpol-AZ31 and PS. Dashed lines in (c) and (d) correspond to the original Mg2+ ion concentration of the medium. Cell density as a function of Mg2+ ion concentration in the medium at (e) day 1 and (f) day 6.

Figure 7. (a–f) Surface and (g–l) cross-sectional SEM images of (a, d, g, j) OCP-, (b, e, h, k) HAp- and (c, f, i, l) Mpol-AZ31 after six days culture of MG-63 cells. Surface images (a–c) with a typical pit and (d–f) without apparent corrosion. Cross-sectional images (g–i) with a relatively thick corrosion layer and (j–l) without obvious corrosion layer.

Figure 7. (a–f) Surface and (g–l) cross-sectional SEM images of (a, d, g, j) OCP-, (b, e, h, k) HAp- and (c, f, i, l) Mpol-AZ31 after six days culture of MG-63 cells. Surface images (a–c) with a typical pit and (d–f) without apparent corrosion. Cross-sectional images (g–i) with a relatively thick corrosion layer and (j–l) without obvious corrosion layer.

Figure 8. Morphology of MG-63 cells on (a) OCP- and (b) HAp-AZ31 at day 1. Focal contact formation of MG-63 cell on (c) OCP- and (d) HAp-AZ31. (c-1, d-1) Anti-paxillin-stained images (focal contact, red), (c-2, d-2) phalloidin-stained images (actin filament, green), (c-3, d-3) DAPI-stained images (nucleus, blue), and (c-4, d-4) composite images of anti-paxillin-, phalloidin- and DAPI-stained images. Surface SEM images of (e) OCP- and (f) HAp-AZ31, with the same magnification as the cell images (c) and (d).

Figure 8. Morphology of MG-63 cells on (a) OCP- and (b) HAp-AZ31 at day 1. Focal contact formation of MG-63 cell on (c) OCP- and (d) HAp-AZ31. (c-1, d-1) Anti-paxillin-stained images (focal contact, red), (c-2, d-2) phalloidin-stained images (actin filament, green), (c-3, d-3) DAPI-stained images (nucleus, blue), and (c-4, d-4) composite images of anti-paxillin-, phalloidin- and DAPI-stained images. Surface SEM images of (e) OCP- and (f) HAp-AZ31, with the same magnification as the cell images (c) and (d).

Figure 9. (a, b) XRD patterns and (c, d) SEM images of outer layer removed (a, c) OCP- and (b, d) HAp-AZ31. Focal contact formation of MG-63 cells on outer layer removed (e) OCP- and (f) HAp-AZ31. Plate-like and rod-like crystals were polished off surface with 6-μm-diamond paste. (e-1, f-1) Anti-paxillin-stained images (focal contact, red), (e-2, f-2) phalloidin-stained images (actin filament, green), (e-3, f-3) DAPI-stained images (nucleus, blue), and (e-4, f-4) composite images of anti-paxillin-, phalloidin- and DAPI-stained images.

Figure 9. (a, b) XRD patterns and (c, d) SEM images of outer layer removed (a, c) OCP- and (b, d) HAp-AZ31. Focal contact formation of MG-63 cells on outer layer removed (e) OCP- and (f) HAp-AZ31. Plate-like and rod-like crystals were polished off surface with 6-μm-diamond paste. (e-1, f-1) Anti-paxillin-stained images (focal contact, red), (e-2, f-2) phalloidin-stained images (actin filament, green), (e-3, f-3) DAPI-stained images (nucleus, blue), and (e-4, f-4) composite images of anti-paxillin-, phalloidin- and DAPI-stained images.

Figure 10. Optical images of the entire area of (a) Mpol-, (b) OCP- and (c) HAp-AZ31 disks, on which a piece of wet pH paper was placed for 30 min. Magnified optical images of pH paper placed on (d) Mpol-, (e) OCP- and (f) HAp-AZ31. (g) Color samples at various pH values.

Figure 10. Optical images of the entire area of (a) Mpol-, (b) OCP- and (c) HAp-AZ31 disks, on which a piece of wet pH paper was placed for 30 min. Magnified optical images of pH paper placed on (d) Mpol-, (e) OCP- and (f) HAp-AZ31. (g) Color samples at various pH values.

Figure 11. Optical images of a piece of H2O2 semi-quantitative test paper placed on the surface of (a) Mpol-, (b) OCP- and (c) HAp-AZ31, (d) Mpol-pure Mg and (e) Mpol-pure Ti. Optical images of a test paper moistened with (f) 2 mol l−1 MgCl2 solution and (g) Mg(OH)2 suspension. (h) Color samples at various H2O2 concentrations.

Figure 11. Optical images of a piece of H2O2 semi-quantitative test paper placed on the surface of (a) Mpol-, (b) OCP- and (c) HAp-AZ31, (d) Mpol-pure Mg and (e) Mpol-pure Ti. Optical images of a test paper moistened with (f) 2 mol l−1 MgCl2 solution and (g) Mg(OH)2 suspension. (h) Color samples at various H2O2 concentrations.
Supplemental material

supplemental_material_161124.docx

Download MS Word (490.5 KB)