Figures & data
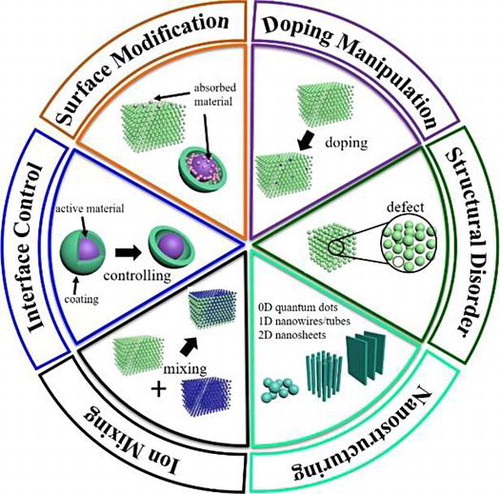
Figure 1. Illustration of some of the important structure–properties relationships discussed in this review.
Figure 2. Li+ transport trajectory in various antisite structures in LiMn0.5Fe0.375Mg0.125BO3 based on NEB calculations. (a) The second lowest energy (Li-trapping); (b) the lowest energy antisite (Li-redirecting) and (c) antisite free structure. Reprinted from [Citation13] with permission from the Royal Society of Chemistry.
![Figure 2. Li+ transport trajectory in various antisite structures in LiMn0.5Fe0.375Mg0.125BO3 based on NEB calculations. (a) The second lowest energy (Li-trapping); (b) the lowest energy antisite (Li-redirecting) and (c) antisite free structure. Reprinted from [Citation13] with permission from the Royal Society of Chemistry.](/cms/asset/0b64924e-ae60-4a6c-89c3-862200606b38/tsta_a_1277503_f0002_oc.gif)
Figure 3. Voltage profiles for Li7Ti5O12 of different sizes. The red curve corresponds to a situation where Li+ ions enter the vacant 16c sites in Li4Ti5O12 and 8a sites in the (111) facet of Li7Ti5O12. The (111) surface is important for increasing the storage capacity. The black and purple curves correspond to particle sizes of 30 and 100 nm, respectively. Reproduced from [Citation40] with permission of 2012 American Chemical Society.
![Figure 3. Voltage profiles for Li7Ti5O12 of different sizes. The red curve corresponds to a situation where Li+ ions enter the vacant 16c sites in Li4Ti5O12 and 8a sites in the (111) facet of Li7Ti5O12. The (111) surface is important for increasing the storage capacity. The black and purple curves correspond to particle sizes of 30 and 100 nm, respectively. Reproduced from [Citation40] with permission of 2012 American Chemical Society.](/cms/asset/5fbb8164-b8bb-42ef-bf78-02ab67605b33/tsta_a_1277503_f0003_oc.gif)
Figure 4. (a) Apparent Li chemical diffusivities and accumulated capacities as a function of voltage obtained by potentiostatic intermittent titration technique. (b) Schematic of size dependence of the channel blockage due to the antisite defects. Reprinted from [Citation12] with a permission from John Wiley & Sons.
![Figure 4. (a) Apparent Li chemical diffusivities and accumulated capacities as a function of voltage obtained by potentiostatic intermittent titration technique. (b) Schematic of size dependence of the channel blockage due to the antisite defects. Reprinted from [Citation12] with a permission from John Wiley & Sons.](/cms/asset/53855720-0313-43f8-9348-3c06823dbc52/tsta_a_1277503_f0004_oc.gif)
Figure 5. Electrochemical characterization of 0.05[Si-F] codoped LiFePO4. (a) Comparison of rate capabilities with other codoping levels and the single ion doping; (b) discharge voltage profiles at different rates; (c) sustainable performance at a high cycling rate of 10C; (d) comparison of electrochemical impedance spectroscopy plots for un-doped LiFePO4 and 0.05[Si-F] codoped LiFePO4. (e–h) band structures of undoped and codoped LiFePO4. Reprinted from [Citation56] with permission from John Wiley & Sons.
![Figure 5. Electrochemical characterization of 0.05[Si-F] codoped LiFePO4. (a) Comparison of rate capabilities with other codoping levels and the single ion doping; (b) discharge voltage profiles at different rates; (c) sustainable performance at a high cycling rate of 10C; (d) comparison of electrochemical impedance spectroscopy plots for un-doped LiFePO4 and 0.05[Si-F] codoped LiFePO4. (e–h) band structures of undoped and codoped LiFePO4. Reprinted from [Citation56] with permission from John Wiley & Sons.](/cms/asset/07a8c67e-d436-4839-9cbe-f548695eac7c/tsta_a_1277503_f0005_b.gif)
Figure 6. (a) Schematic drawing of pore diffusion in the porous organic layer of EEI and knock-off diffusion in the dense inorganic layer of EEI. The open circles represent the Li+ in the EEI. In the porous organic layer, the blue solid lines denote channels through which Li+ in the electrolyte (green filled circles) transports with anions (yellow filled circles) via pore diffusion. The red arrows denote that only Li+ can diffuse in the dense inorganic layer via the knock-off mechanism. (b) TOF-SIMS measured (by the isotope exchange experiment) depth profiles of 6Li+/7Li+ and 11B+ (symbols) for the EEI growing on a Cu substrate after 900 s soaking and calculated depth profiles of 6Li+/7Li+ (solid lines) after 10−7, 6, and 900 s soaking. Reproduced from [Citation80] with permission of 2012 American Chemical Society.
![Figure 6. (a) Schematic drawing of pore diffusion in the porous organic layer of EEI and knock-off diffusion in the dense inorganic layer of EEI. The open circles represent the Li+ in the EEI. In the porous organic layer, the blue solid lines denote channels through which Li+ in the electrolyte (green filled circles) transports with anions (yellow filled circles) via pore diffusion. The red arrows denote that only Li+ can diffuse in the dense inorganic layer via the knock-off mechanism. (b) TOF-SIMS measured (by the isotope exchange experiment) depth profiles of 6Li+/7Li+ and 11B+ (symbols) for the EEI growing on a Cu substrate after 900 s soaking and calculated depth profiles of 6Li+/7Li+ (solid lines) after 10−7, 6, and 900 s soaking. Reproduced from [Citation80] with permission of 2012 American Chemical Society.](/cms/asset/f13cb5c9-3323-49bb-ad7c-e581d53a6ac9/tsta_a_1277503_f0006_oc.gif)
Figure 7. Flow chart of high-throughput calculations with different computational level in accuracy to screen high-performance electrode and solid electrolyte materials. The dashed rectangle is introduced in this review. The theoretical capacity, voltage, and redox are set to 150 mA h g–1, 1.5 V, and 4.0 V, respectively, as an example.