Figures & data
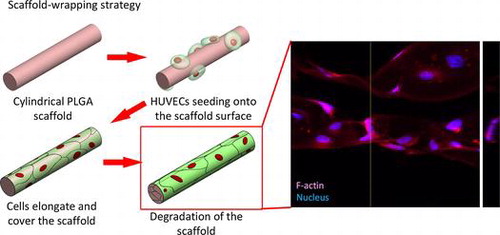
Figure 1. Mask design and PDMS replica mold. (A) Pattern of the mask which contained several double rhombuses with 30-μm-wide edges. (B) Front view of the PDMS replica mold. (C) Cross section of the PDMS mold cut at the dotted line to reveal the hemi-cylindrical structure.
Figure 2. Viability of HUVECs on PLGA50/50 material. Cell numbers were analyzed by WST-1 assay after seeding on PLGA member for three and seven days, respectively (n = 5).
Figure 3. PLGA scaffold. (A) Entire PLGA film with eight individual hexagons (red square). (B) The double rhombus structure within each hexagon. Scale bar: 100 μm.
Figure 4. The formation of the microvascular network according to designed pattern. (A) Bright-field image. (B) The fluorescence of the BMVC doped scaffold. (C) Nucleus and actin filaments stained by DAPI and phalloidin. (D) Merged image of the fluorescence from the scaffold, actin, and nucleus. Scale bar: 100 μm.
Figure 5. 3D confocal microscopy image of HUVE-cultured scaffold. Arrows point out the area in which Z-axis cross-section was performed. Scale bar: 20 μm. Depth of Z-axis: 12 μm.
Figure 6. Immunofluorescent staining of CD31 and VE-cadherin. (A) Bright-field image. (B) Merged image of the nucleus and CD31. (C) Merged image of the nucleus and VE-cadherin. (D) Merged image of the nucleus, CD31 and VE-cadherin. Scale bar: 25 μm.
Scheme 1. Formation of a microvessel through the scaffold-wrapping strategy.
Scheme 2. Schematic of the cylindrical PLGA scaffold fabrication. Tg stands for glass transition temperature.