Figures & data
Figure 1. Surface energy of the nonwoven fabrics vs. plasma exposure time, measured via the OWRK method [Citation26]. Fit line and data points for C2F6 treated lyocell, unless specified otherwise. Data are the mean of five replicates. Error bars = standard deviation.
![Figure 1. Surface energy of the nonwoven fabrics vs. plasma exposure time, measured via the OWRK method [Citation26]. Fit line and data points for C2F6 treated lyocell, unless specified otherwise. Data are the mean of five replicates. Error bars = standard deviation.](/cms/asset/5eb53893-cc8b-4a82-8671-5487caf79e18/tsta_a_1288543_f0001_b.gif)
Figure 2. Negative ion ToF-SIMS spectra of untreated and C2F6 plasma treated lyocell nonwoven fabrics. Mass range m/z = 0–360.
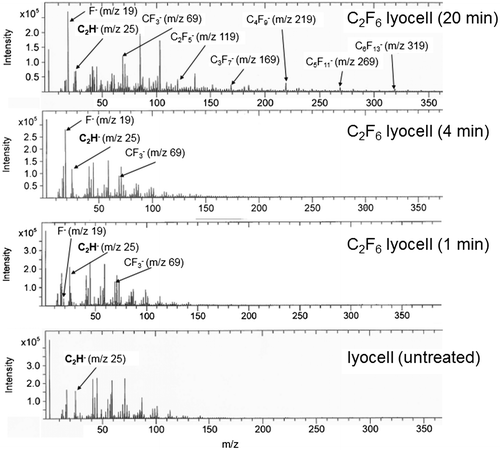
Figure 3. AFM micrographs of untreated and plasma treated fibre surfaces. (A) Untreated lyocell fibre surface; (B) C2F6 plasma-treated lyocell fibre surface after 1 min exposure; (C) C2F6 plasma-treated lyocell fibre surface after 4 min exposure; (D) C2F6 plasma-treated lyocell fibre surface after 20 min exposure; (E) O2 plasma-treated lyocell fibre surface after 20 min exposure; (F) untreated polypropylene fibre surface.
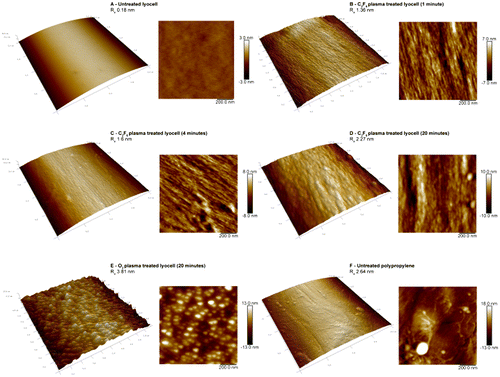
Table 1. Mean contact angles and wetting tensions of PMMA wiping surfaces according to organic load, as measured by goniometry.
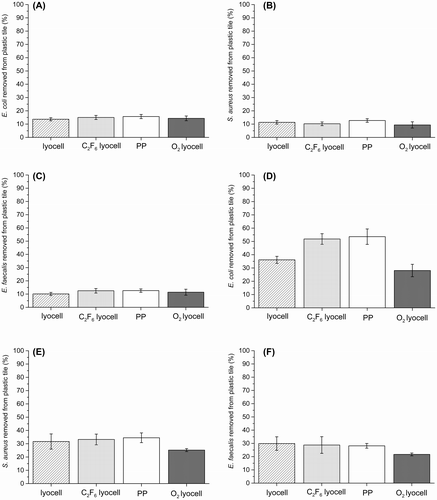
Figure 4. Bacterial removal by wiping. (A) Mean E. coli removal by adpression method; (B) mean S. aureus removal by adpression method; (C) mean E. faecalis removal by adpression method; (D) mean E. coli removal by dynamic wiping; (E) mean S. aureus removal by dynamic wiping; (F) mean E. faecalis removal by dynamic wiping. Data presented are the average of nine replicates and error bars represent standard error of the mean.
