Figures & data
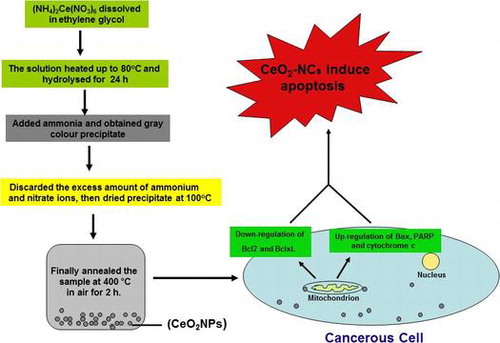
Figure 1. HT29 cell viability assessed based on the frequency of surviving cells after 48 h exposure to different concentrations of CeO2 nanoparticles by MTT assay. The IC50 was found to be 2.26 μg ml–1. Error bars indicate standard deviation (n = 3).
Figure 2. SW620 cell viability assessed based on the frequency of surviving cells after 48 h exposure to different concentrations of CeO2-NCs by MTT assay. The IC50 values were found to be 121.18 μg ml–1. Error bars indicate standard deviation (n = 3).
Figure 3. Inverted microscopy results show the potential effect of CeO2-NCs by crystal violet staining. (A) No significant effects were observed on untreated HT29 cells (control). (B–D) HT29 cells were treated with different concentrations of CeO2-NCs. Alterations in morphology and reductions in cell number indicate the activity of CeO2-NCs. Bars = 10 μm.
Figure 4. The microphotographs obtained by fluorescence microscopy indicate changes in mitochondrial membrane potential (MMP). (A) Untreated HT29 cells were used as a control. (B) HT29 cells showed significant changes in mitochondrial membrane potential (MMP) after treatment with CeO2-NCs. Bars = 10 μm.
Figure 5. Western blot assessment of the expression of the anti-apoptotic proteins Bcl-2, Bcl-xL, and β-actin (control) in HT29 cells treated with 2.26 μg ml–1 CeO2 NCs for 24 h; controls were untreated HT29 cells. Immunoblot images show the expression levels of anti-apoptotic proteins. (A) Down-regulation of Bcl-2 expression was observed by immunoblot. (B) Down-regulation of Bcl-xL expression was observed by immunoblot. (C) Expression levels of β-actin (control) were unchanged.
Figure 6. Western blot analysis of the pro-apoptotic proteins Bax, PARP, cytochrome c, and β-actin (control) in HT29 cells treated with 2.26 μg ml–1 CeO2-NCs for 24 h; untreated HT29 cells served as controls. Immunoblot analyses of the expression levels of apoptotic proteins are shown. (A). Up-regulation of the expression of Bax. (B). Up-regulation of the expression of PARP. (C). Up-regulation of the expression of cytochrome c. (D) No significant change in the expression of β-actin (control).
Figure 7. An in vitro biocompatibility assay shows possible hemolysis of CeO2 NCs compared with both positive and negative controls. (A) The test sample (CeO2-NCs) showed minimum destruction of RBCs, and the negative sample exhibited no RBC destruction compared with the positive control. (B) The percentage of hemolysis in test samples and the positive control.