Figures & data
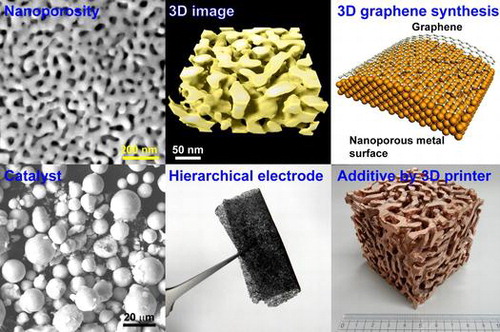
Figure 1. (a) A 3D image of NPG. (b) Skeletal network of the gold ligaments generated by using a 3D thinning algorithm. (c) A magnified TEM micrograph of the silver-plated NPG. (Adapted with permission from Ref. [Citation32]. Copyright (2008) American Chemical Society.) (d) A schematic diagram of the nanoporous metal core-shell structure. (Adapted with permission from Ref. [Citation63]. Copyright (2009) American Chemical Society.).
![Figure 1. (a) A 3D image of NPG. (b) Skeletal network of the gold ligaments generated by using a 3D thinning algorithm. (c) A magnified TEM micrograph of the silver-plated NPG. (Adapted with permission from Ref. [Citation32]. Copyright (2008) American Chemical Society.) (d) A schematic diagram of the nanoporous metal core-shell structure. (Adapted with permission from Ref. [Citation63]. Copyright (2009) American Chemical Society.).](/cms/asset/e18fcd64-5015-45c6-bdb6-7ae184cbd29d/tsta_a_1377047_f0001_oc.gif)
Figure 2. A STEM image of NPG obtained via low energy-loss electron spectroscopy. The region of interest (displayed in the inset) is denoted by the yellow square. The energy-loss images obtained at 1.3 and 2.0 eV are shown in order to visualize the corresponding surface plasmon energies.
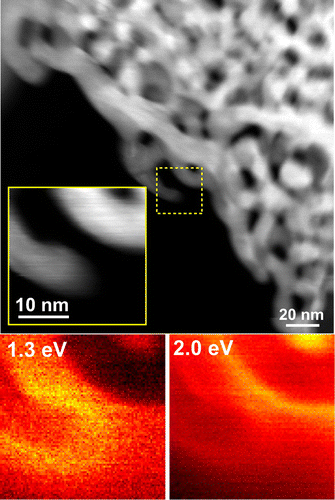
Figure 3. (a) A schematic describing the preparation of wrinkled nanoporous films. (b) A microstructure of the wrinkled nanoporous film with a quasi-periodic wavelength of 10–15 μm. (c) A photograph of the wrinkled nanoporous film with dimensions of 8 mm × 8 mm. (d) A microstructure of the wrinkled ridges containing nanogaps, interleaving broken ligaments, and linear chains of self-similar nanocavities. (e) A single-molecule SERS spectrum of 10-12 M adenine solution with selected Raman bands. (Adapted from Ref. [Citation62]. Copyright Liu et al. (Citation2011)).
![Figure 3. (a) A schematic describing the preparation of wrinkled nanoporous films. (b) A microstructure of the wrinkled nanoporous film with a quasi-periodic wavelength of 10–15 μm. (c) A photograph of the wrinkled nanoporous film with dimensions of 8 mm × 8 mm. (d) A microstructure of the wrinkled ridges containing nanogaps, interleaving broken ligaments, and linear chains of self-similar nanocavities. (e) A single-molecule SERS spectrum of 10-12 M adenine solution with selected Raman bands. (Adapted from Ref. [Citation62]. Copyright Liu et al. (Citation2011)).](/cms/asset/2959f080-6964-45c5-a2fb-d88b2d5d6faf/tsta_a_1377047_f0003_oc.gif)
Figure 4. (a) TEM (upper panel) and STEM (lower panel) images of NPG obtained at low and high magnifications, respectively. (b) Reconstructed 3D atomic configuration of the NPG ligament. Different colors denote the surface atoms with different coordination numbers. (c) An environmental TEM image of the rugged surface obtained during CO oxidation and in the absence of any reactions. Panels (a) and (c) are adapted from Ref. [Citation72]. © Macmillan Publishers Limited, Springer Nature. Panel (b) is adapted from Ref. [Citation73]. © WILEY-VCH Verlag GmbH & Co. KGaA, Weinheim.
![Figure 4. (a) TEM (upper panel) and STEM (lower panel) images of NPG obtained at low and high magnifications, respectively. (b) Reconstructed 3D atomic configuration of the NPG ligament. Different colors denote the surface atoms with different coordination numbers. (c) An environmental TEM image of the rugged surface obtained during CO oxidation and in the absence of any reactions. Panels (a) and (c) are adapted from Ref. [Citation72]. © Macmillan Publishers Limited, Springer Nature. Panel (b) is adapted from Ref. [Citation73]. © WILEY-VCH Verlag GmbH & Co. KGaA, Weinheim.](/cms/asset/818f8ed0-e7b2-4a1b-8636-87c366bb1e41/tsta_a_1377047_f0004_oc.gif)
Figure 5. (a) Microstructures of nanoporous CuNiMnO after NO reduction durability testing. The obtained STEM image and EDS chemical maps of the selected area show the distributions of Cu (red), Ni (green), Mn (blue), and O (orange) elements. (b) A schematic diagram of the new concept of catalyst design, in which the active metal is tangled with the nanoporous oxide. The described system exhibits higher density of the perimeter interfaces as compared to that in the conventional nanoparticle/oxide system. (c) A photograph of the mass-produced nanoporous CuNiMnO catalysts. (d) An SEM image of the gas-atomized micropowders after dealloying. Panels (a), (c), and (d) adapted from Ref. [Citation82]. © WILEY-VCH Verlag GmbH & Co. KGaA, Weinheim.
![Figure 5. (a) Microstructures of nanoporous CuNiMnO after NO reduction durability testing. The obtained STEM image and EDS chemical maps of the selected area show the distributions of Cu (red), Ni (green), Mn (blue), and O (orange) elements. (b) A schematic diagram of the new concept of catalyst design, in which the active metal is tangled with the nanoporous oxide. The described system exhibits higher density of the perimeter interfaces as compared to that in the conventional nanoparticle/oxide system. (c) A photograph of the mass-produced nanoporous CuNiMnO catalysts. (d) An SEM image of the gas-atomized micropowders after dealloying. Panels (a), (c), and (d) adapted from Ref. [Citation82]. © WILEY-VCH Verlag GmbH & Co. KGaA, Weinheim.](/cms/asset/48af723f-e040-4e1d-990f-e731606fe23d/tsta_a_1377047_f0005_oc.gif)
Figure 6. (a) and (b) Representative SEM and TEM images of the 3D nanoporous graphene, respectively. (c) EELS chemical maps of the C, N, and S elemental distributions in the doped nanoporous graphene. (Adapted from Ref. [Citation90]. © Wiley-VCH Verlag GmbH & Co. KGaA, Weinheim.).
![Figure 6. (a) and (b) Representative SEM and TEM images of the 3D nanoporous graphene, respectively. (c) EELS chemical maps of the C, N, and S elemental distributions in the doped nanoporous graphene. (Adapted from Ref. [Citation90]. © Wiley-VCH Verlag GmbH & Co. KGaA, Weinheim.).](/cms/asset/8c219f97-6d04-487f-b69f-0ed35f59e09c/tsta_a_1377047_f0006_oc.gif)
Figure 7. Steam generation by a thin porous graphene sheet. (a) An optical image of the piece of porous N-doped graphene sheet. (b) A schematic description of the heat localization system, which converts sunlight into steam using a piece of porous N-doped graphene as the steam generator. Thin porous graphene plays a versatile role in harvesting solar illumination as thermal energy. (c) An optical image of the steam generation process, in which the scrap from panel (b) is placed under the concentrated solar illumination. (Adapted from Ref. [Citation98]. © Wiley-VCH Verlag GmbH & Co. KGaA, Weinheim).
![Figure 7. Steam generation by a thin porous graphene sheet. (a) An optical image of the piece of porous N-doped graphene sheet. (b) A schematic description of the heat localization system, which converts sunlight into steam using a piece of porous N-doped graphene as the steam generator. Thin porous graphene plays a versatile role in harvesting solar illumination as thermal energy. (c) An optical image of the steam generation process, in which the scrap from panel (b) is placed under the concentrated solar illumination. (Adapted from Ref. [Citation98]. © Wiley-VCH Verlag GmbH & Co. KGaA, Weinheim).](/cms/asset/7c1bf454-5faf-4ed3-804f-d373682bebe9/tsta_a_1377047_f0007_oc.gif)
Figure 8. Three basic strategies (1–3) of the hierarchical pore fabrication via dealloying. The details of the corresponding procedures are explained in the main text.
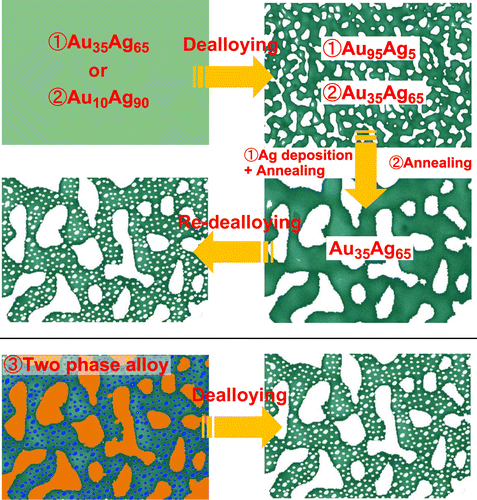
Figure 9. SEM images of the hierarchical NPG. (a) Coarsened nanoporous AuAg alloy with a pore size of 80–100 nm. (b) Hierarchical NPG particles containing small pores with diameters of 5–20 nm on the surface of ligaments with sizes of 80–100 nm. (Adapted from Ref. [Citation102]. Copyright Guo et al (Citation2016)).
![Figure 9. SEM images of the hierarchical NPG. (a) Coarsened nanoporous AuAg alloy with a pore size of 80–100 nm. (b) Hierarchical NPG particles containing small pores with diameters of 5–20 nm on the surface of ligaments with sizes of 80–100 nm. (Adapted from Ref. [Citation102]. Copyright Guo et al (Citation2016)).](/cms/asset/bdc7abe7-a5ea-4dbb-9ccd-e9059668c34b/tsta_a_1377047_f0009_oc.gif)
Figure 10. (a) A schematic describing the creation of a hierarchical porous structure by sintering a slurry of metal powder mixed with water-soluble binder on a paper sheet. (b) A 50 μm thick Ni30Mn70 alloy sheet (the logo of Tohoku University is located on the reverse side). (c) A bendable thin dealloyed Ni30Mn70 alloy sheet. (d) SEM images of the Ni30Mn70 microporous nanostructure obtained after dealloying. (e) STEM image and chemical maps of the selected area containing the distributions of Ni (red), Mn (green), and O (blue) elements. (f) SEM images of the Cu15Ni10Fe5Mn70 microporous metal alloy (shown in the inset) obtained after dealloying. (Panels (a)–(e) are adapted from Ref. [Citation104]. Copyright Fujita et al. (Citation2015)).
![Figure 10. (a) A schematic describing the creation of a hierarchical porous structure by sintering a slurry of metal powder mixed with water-soluble binder on a paper sheet. (b) A 50 μm thick Ni30Mn70 alloy sheet (the logo of Tohoku University is located on the reverse side). (c) A bendable thin dealloyed Ni30Mn70 alloy sheet. (d) SEM images of the Ni30Mn70 microporous nanostructure obtained after dealloying. (e) STEM image and chemical maps of the selected area containing the distributions of Ni (red), Mn (green), and O (blue) elements. (f) SEM images of the Cu15Ni10Fe5Mn70 microporous metal alloy (shown in the inset) obtained after dealloying. (Panels (a)–(e) are adapted from Ref. [Citation104]. Copyright Fujita et al. (Citation2015)).](/cms/asset/17faa231-cea2-4731-829a-9fe54f77f342/tsta_a_1377047_f0010_oc.gif)
Figure 11. (a) A SEM image of the nanoporous Cu microspheres dispersed among the cellulose nanofibers. (b) A photograph of the gyroid shapes fabricated from acrylonitrile butadiene styrene (ABS) resin (left) and Ti–6Al–4V alloy (right). (c) A photograph of the randomly selected porous ABS resin composited with dispersed nanoporous Cu microspheres. The SEM surface images were obtained both at low and high magnifications.
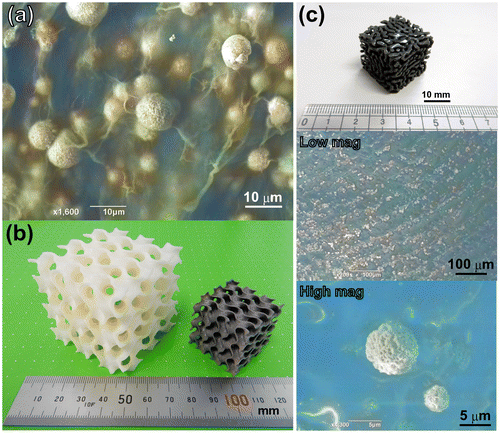
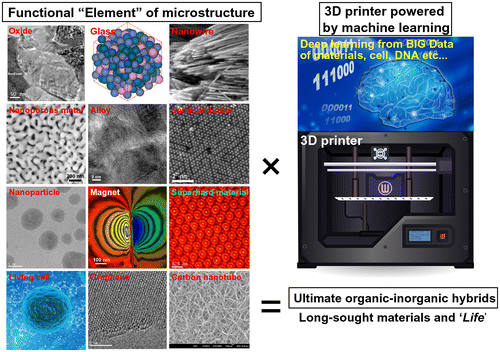
Figure 12. Future perspective: toward achieving the ultimate 3D functionality based on the concept of the ‘functional elements of microstructure’, which is similar to periodic tables. A super 3D printing technology powered by the ultimate AI might discover the long-sought organic-inorganic hybrids that represent ‘life’.
